The hurricane that struck in August did more than disrupt immediate energy output; its ripple effects persisted well into October and continued to cast a shadow over asset behavior in the near term. Here’s how that residual impact played out — and how markets had to adapt to the “aftershocks.”
The Lingering Supply Disruption
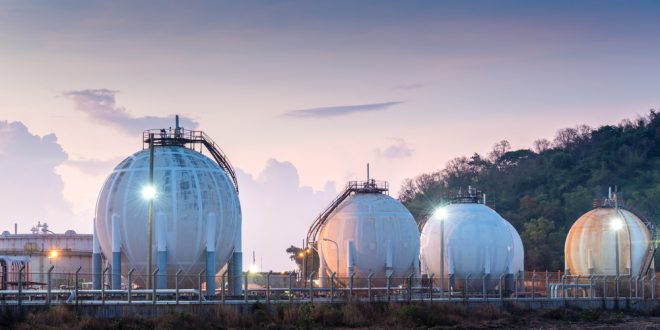
Though months had passed since Katrina’s landfall, key energy infrastructure in the Gulf region remained vulnerable and partially offline. Some offshore platforms, pipelines, and refineries had not fully resumed normal operations. The incomplete restoration meant that supply-side fragility remained — any additional shock or bottleneck could re-ignite price stresses.
This “persistent supply risk” kept traders cautious. Instead of assuming a full return to pre-Katrina normalcy, markets now priced in a risk premium for future outages and bottlenecks. In effect, the system had a more built-in “fragility tax” on energy-related assets.
Asset Effects in October, Near Term
Crude Oil & Refined Spreads
Oil futures remained elevated relative to pre-storm norms. The market’s mindset shifted from a pure recovery trade to one of sustained vulnerability. Refining margins (the premium of product over crude) also widened because some refiners — especially those along the Gulf — had limited ability to absorb the shock. Traders watched very closely for weekly inventory data or news of further outages, since surprises could trigger sharp moves.
Natural Gas / Gas Infrastructure
Natural gas also saw sustained volatility. With many gas extraction or processing facilities still compromised, bilateral contracts and regional supply were under strain. Forward contracts (for months ahead) reflected expectations that the supply tightness could last until all infrastructures were fully operational.
Energy, Infrastructure Equities
Energy companies, pipeline operators, and infrastructure firms were revalued under this new risk paradigm. Firms with diversified footprints or alternative supply routes attracted relative preference. But even robust names carried higher volatility — investors demanded compensation for uncertainty.
Treasuries, Yields
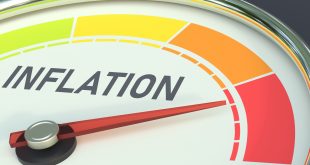
The expectation of significant reconstruction spending raised concerns over budget deficits and inflation. Thus, intermediate-to-long Treasury yields (e.g. 10-year) moved higher, as bond markets priced in the dual forces of fiscal stimulus and upward price pressures.
U.S. Dollar, Risk Sentiment
While the U.S. dollar benefited in part from its status as a safe-haven, commodity-linked currencies (e.g. those tied to energy exports) were more volatile. The ongoing energy uncertainty meant that global capital flows were sensitive to every new signal (e.g. demand outlook, geopolitical risk).
The “Aftershock” Phase: What Markets Must Watch
Rebuild demand tailwinds: The process of reconstruction drives consumption of energy, materials, machinery, and industrial goods. If that demand is persistent, it supports higher commodity prices and companies aligned with rebuilding.
Bottleneck flare-ups: Even a small new disruption (a pipeline leak, a power failure, a seasonal storm) could amplify volatility because the system is already stressed.
Inflation creep: Sustained energy and materials prices feed into broader inflation, forcing central banks and bond markets to recalibrate expectations.
Shifting correlations: Assets that were previously loosely tied to energy may become more correlated. For example, industrial equities might more closely follow energy sector swings.
Risk premium re-calibration: Investors may require higher returns for staying exposed in sectors vulnerable to external shocks (energy, infrastructure, transport).
In short: Katrina’s impact did not end in August. Its echo — in the form of supply fragility, reconstruction demand, inflation pressure, and elevated risk premia — had to be actively managed by markets in October and for months thereafter. The “aftershock” wasn’t just a metaphor — it became a structural element baked into how assets traded.