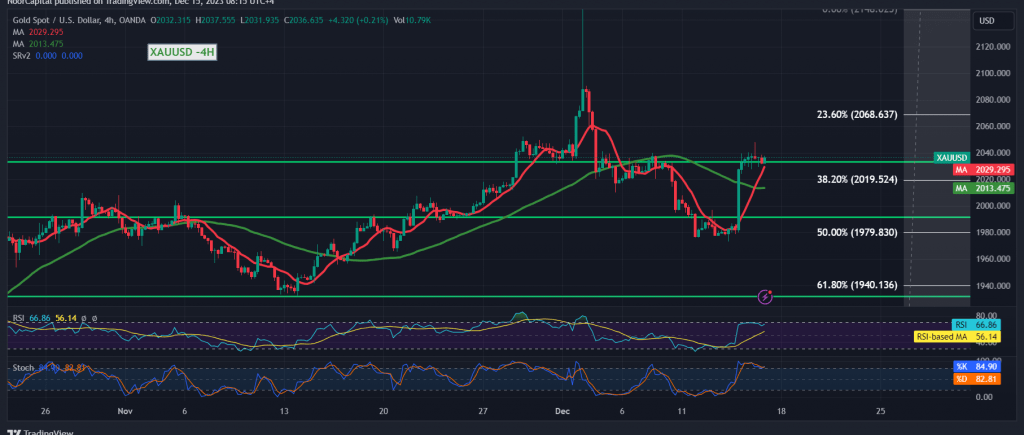
Gold prices experienced a positive trading session as they sought to consolidate around the crucial support floor established in 2024, reaching a pinnacle at $2047 per ounce.
In today’s technical analysis, a detailed examination of the 4-hour time frame chart reveals that the price remains steadfastly above the 2024 level, and more broadly above 2019, which represents the 38.20% Fibonacci retracement. Notably, the convergence of the 50-day simple moving average around this Fibonacci level is observed, alongside encouraging signals from the relative strength index.
As long as intraday trading maintains its position above 2019, there exists a potential for the upward momentum initiated during the previous session to persist. However, this continuation is contingent upon a clear and robust breach of the 2040 resistance level. Such a breakthrough not only fortifies but also accelerates the strength of the daily upward trend, setting the stage for the first target at 2047, with potential gains extending to 2058.
Conversely, a downside scenario involves the closure of an hour candle below 2019, putting gold under negative pressure and possibly leading to a retest of the 2000 level.
Caution is advised as the risk level is deemed high. This caution is particularly pertinent in the current geopolitical landscape, characterized by ongoing tensions, and it is crucial to be prepared for elevated price volatility.
Note: Trading on CFDs involves risks. Therefore, all scenarios may be possible. This article is not a recommendation to buy or sell but rather an explanatory reading of the price movement on the chart.
| S1: |
 Noor Trends News, Technical Analysis, Educational Tools and Recommendations

