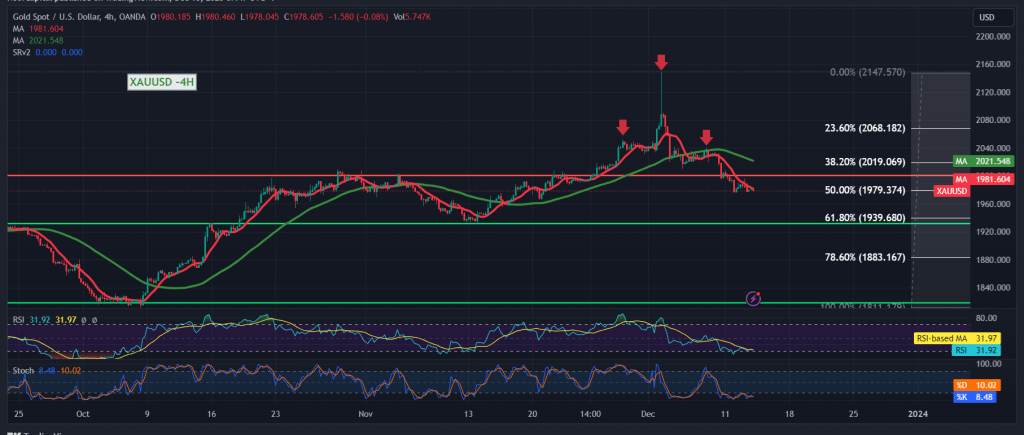
The technical outlook for gold remains unchanged, with no significant shifts in its movements and a persistent negative stability below the crucial $2000 psychological barrier resistance level.
In the realm of technical analysis today, a closer examination of the 4-hour time frame chart reveals sustained negative pressure from the simple moving averages, aligning with the daily downward trend. This is accentuated by a decline in upward momentum, evident on the 14-day momentum indicator.
Given the current intraday trading conditions below $2000, particularly emphasizing $2003, the validity and effectiveness of the downward correction persist. The initial target is set at 1971, followed by 1957. It’s noteworthy that a breach below 1957 extends the downward correction goals towards 1938, representing the 61.80% correction level.
A crucial point to bear in mind is that a decisive upward crossover and consolidation of the price for at least an hour candle above $2003 would promptly halt the prevailing downward trend. In such a scenario, anticipation centers around gold stabilizing around 2019 and 2021 initially.
Two warnings accompany this analysis: Firstly, today brings the anticipation of high-impact economic data from the US, including inflation numbers via the “Producer Price Index,” a Federal Reserve Committee statement, a Federal Reserve press conference, interest rate decisions, and economic forecasts. This may lead to significant price fluctuations at the time of the news release. Secondly, the current geopolitical tensions contribute to elevated risk levels, potentially resulting in heightened price volatility. Exercise prudence in navigating these dynamic market conditions.
Note: Trading on CFDs involves risks. Therefore, all scenarios may be possible. This article is not a recommendation to buy or sell but rather an explanatory reading of the price movement on the chart.
| S1: |
 Noor Trends News, Technical Analysis, Educational Tools and Recommendations

