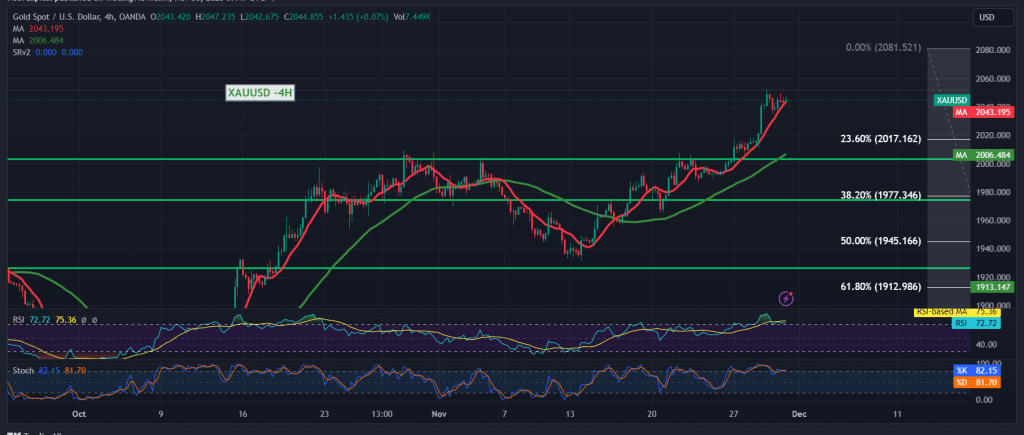
Gold prices are endeavoring to sustain the gains made throughout this week’s trading, reaching a peak yesterday at around $2052 per ounce.
From a technical analysis perspective today, on the 240-minute time frame chart, the 50-day simple moving average continues to support the ongoing upward trend. This support is reinforced by clear positive signals on the 14-day momentum indicator.
With intraday trading remaining above 2036, the bullish trend persists, contingent on a clear price consolidation above 2050. This consolidation could propel the gains towards 2061, serving as the initial station, followed by 2070, the subsequent official station.
It’s crucial to note that the consolidation above 2050 is a fundamental condition for the sustained upward wave. Failure to breach this level may induce price pressure, leading to a visit to 2027 and 2020 before renewed attempts at an upward trajectory.
Caution: The Stochastic indicator hovers around overbought areas, indicating potential price fluctuation until a definitive direction is established.
Caution: High-impact economic data is anticipated from the US today, particularly the annual “Core Personal Consumer Expenditure Price Index.” Expect heightened volatility upon the release of this news.
Caution: The level of risk remains elevated amidst ongoing geopolitical tensions, contributing to the potential for increased price volatility.
Note: Trading on CFDs involves risks. Therefore, all scenarios may be possible. This article is not a recommendation to buy or sell but rather an explanatory reading of the price movement on the chart.
| S1: |
 Noor Trends News, Technical Analysis, Educational Tools and Recommendations

