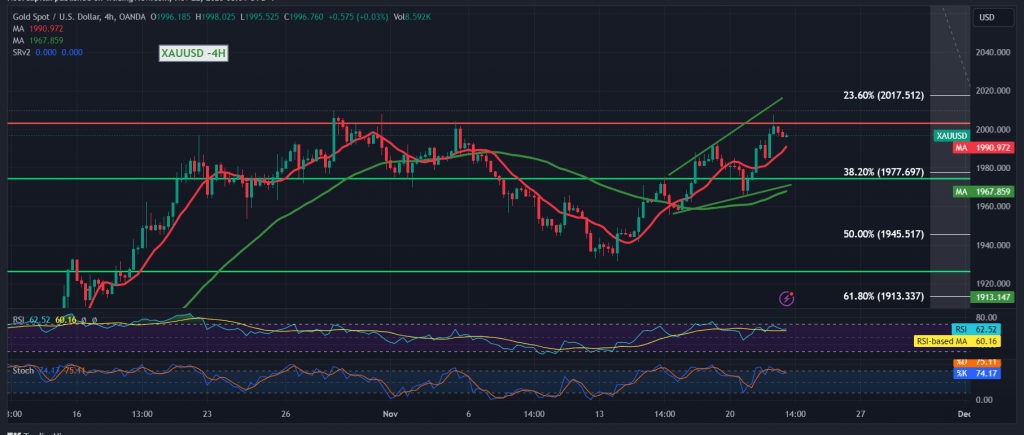
Gold prices demonstrated significant gains during the recent trading session, initiating an advance towards the $2,000 per ounce level, confirming the positive outlook as anticipated in the previous technical report. The precious metal touched the initial target of $2004, reaching its peak at $2007.
From a technical standpoint today, the price remains generally stable above the critical support level for the current trading levels, situated at 1977 and corresponding to the 38.20% Fibonacci retracement. The 50-day simple moving average continues to support the price from below, converging around 1977 and reinforcing its significance. Furthermore, the 14-day momentum indicator exhibits efforts to gain additional momentum.
Maintaining stability above the pivotal support level of 1977 encourages positive expectations, contingent upon a breach of 2009. Such a breach would pave the way for substantial gains, commencing at 2014/2017 and extending towards 2023 initially.
On the flip side, the failure of gold prices to consolidate above the primary support at 1977 puts the price under substantial negative pressure, potentially leading to a trading session in negative territory, with targets commencing at 1963.
Risk levels may be elevated.
A word of caution: Today, high-impact economic data is anticipated from the American economy, specifically the revised reading of the Consumer Confidence Index from the University of Michigan, along with a press talk by the Governor of the Bank of Canada. This could result in heightened price fluctuation. Additionally, the overall risk remains high amid ongoing geopolitical tensions, potentially leading to increased price volatility.
Note: Trading on CFDs involves risks. Therefore, all scenarios may be possible. This article is not a recommendation to buy or sell but rather an explanatory reading of the price movement on the chart.
| S1: |
 Noor Trends News, Technical Analysis, Educational Tools and Recommendations

