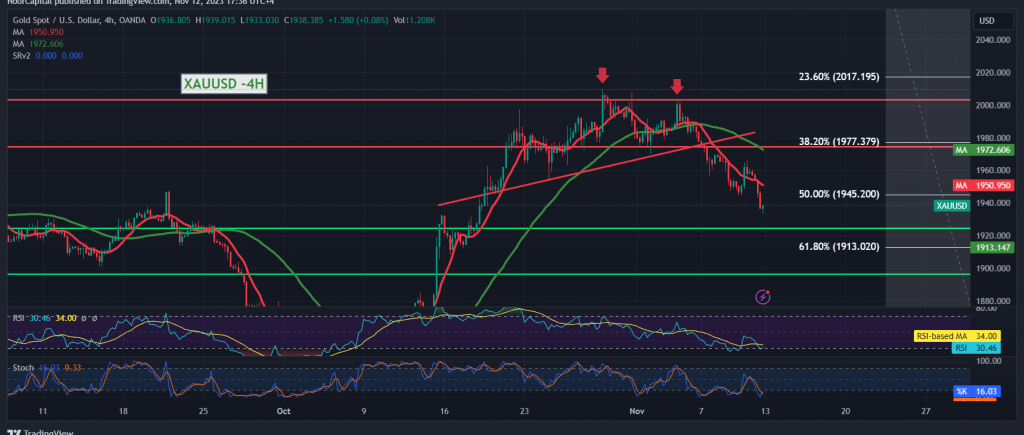
Gold prices have successfully reached the specified target outlined in the previous technical report, settling at the price of 1934 and marking its lowest level at $1933 per ounce.
Upon closer examination from a technical analysis perspective, focusing on the 4-hour time frame chart, the influence of the simple moving averages remains a negative pressure factor from above. Additionally, the price maintains stability below the 1945 support level, represented by the 50.0% Fibonacci retracement as illustrated on the chart.
Given the current scenario, with intraday trading stability below the previously breached support of 1945 and, more broadly, below 1954, the prevailing expectation for today’s trading session is a continuation of the bearish trend. This is contingent upon witnessing price consolidation below 1933, paving the way directly towards 1927 (the first target) and subsequently 1913 (the next official station), marked by the Fibonacci correction level of 61.80%.
It is crucial to note that the resurgence of trading stability above 1954 may delay the likelihood of a decline without eliminating it entirely. In such a case, recovery attempts could be observed, targeting a retest of 1962 and 1970.
Warning: The overall risk level is elevated due to ongoing geopolitical tensions, potentially resulting in increased price volatility.
Note: Trading on CFDs involves risks. Therefore, all scenarios may be possible. This article is not a recommendation to buy or sell but rather an explanatory reading of the price movement on the chart.
| S1: |
 Noor Trends News, Technical Analysis, Educational Tools and Recommendations

