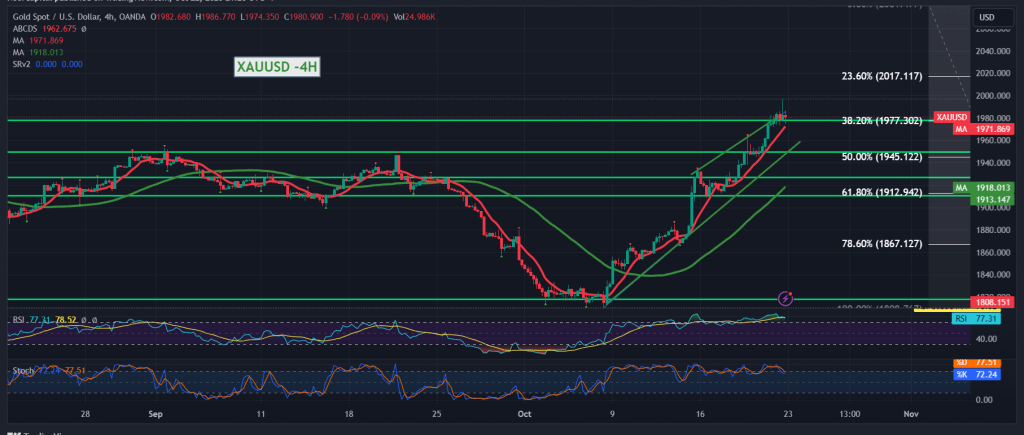
Gold prices continued to rise within the general upward trend expected in the previous technical report. They exceeded the official station required to be touched at the price of 1976, recording their highest level of $1997 per ounce.
On the technical side today, looking at the 240-minute time frame chart, we notice that gold prices continue to receive a positive stimulus from the simple moving averages, which continue to hold the price from below. In addition, the breach of the 1969 resistance level has been confirmed and converted into a support level.
Hence, the rise can still be resumed effectively, as exceeding the levels of 1979 and 1997 can extend the gains towards 2008 and 2019.
Closing the candle at least 4 hours below 1969 postpones the chances of a rise but does not cancel them. We may initially witness a retest of 1958 and 1947 before the market attempts to rise again.
Note: Trading on CFDs involves risks. Therefore, all scenarios may be possible. This article is not a recommendation to buy or sell but rather an explanatory reading of the price movement on the chart.
| S1: |
 Noor Trends News, Technical Analysis, Educational Tools and Recommendations

