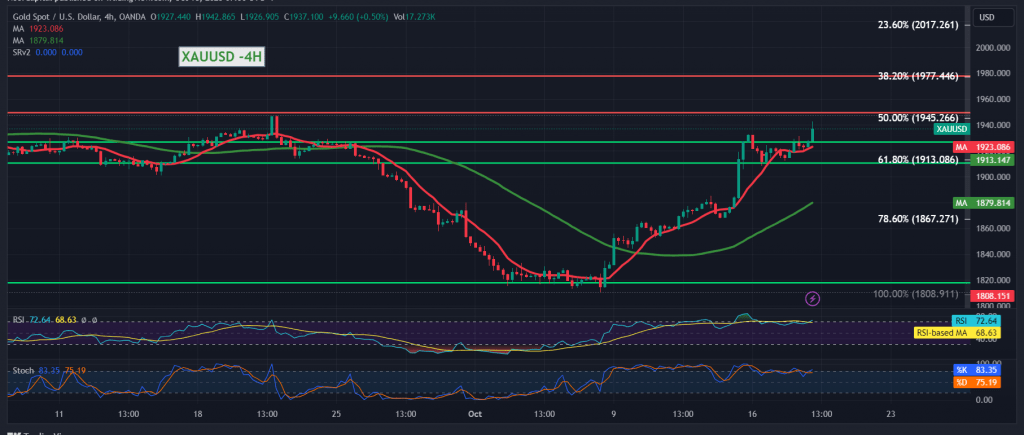
Gold prices achieved a noticeable base above the main support floor mentioned during the previous technical report, located at the price of 1913. In achieving an upward rebound, as we expected, they touched the first official target of 1929 and approached by a few points from the next stop, 1945, only to record their highest level of 1942% per ounce during early trading for the current session.
Today’s technical vision indicates the possibility of extending the current upward wave, with trading remaining above the main support 1913 represented by the 61.80% Fibonacci retracement as shown on the 240 time interval chart, in addition to the positive motivation coming from the simple moving averages.
Therefore, the bullish scenario remains the most preferable, taking into account that crossing upwards and consolidating the price above 1945, the 50.0% Fibonacci retracement, increases and accelerates the strength of the upward trend, so that we are waiting for 1953 and 1959 as initial targets that may extend later towards 1976.
Trading stability below 1913 with the closing of the 4-hour candle below it may invalidate the activation of the proposed scenario. We are witnessing a rapid decline towards retesting 1905 and 1900, respectively, and the losses may extend towards 1889.
Note: The stochastic indicator is near overbought areas, and we may witness some fluctuation before obtaining the official direction.
Note: Trading on CFDs involves risks. Therefore, all scenarios may be possible. This article is not a recommendation to buy or sell but rather an explanatory reading of the price movement on the chart.
| S1: |
 Noor Trends News, Technical Analysis, Educational Tools and Recommendations

