
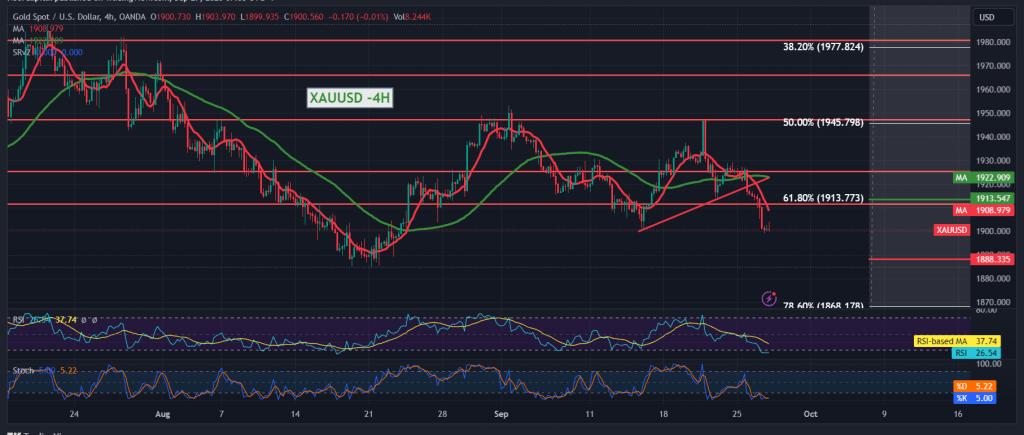
Gold prices achieved the official target published during the previous technical report, explaining that breaking the main support floor for the current trading levels of 1913 led the price to visit 1903, recording its lowest level at $1899 per ounce.
Technically, today, by looking at the 4-hour chart, we find that gold prices succeeded in breaking the 1913 61.80% Fibonacci retracement and turned into a resistance level. We also find that the simple moving averages continue to exert negative pressure on the price from above.
This encourages us to maintain our negative expectations, continuing towards the official target of the current downward wave of 1894, and the losses may extend later towards 1888 and 1880, the next stations.
The success of gold prices in consolidating above 1913 with the closing of the hourly candle may postpone the proposed bearish scenario and lead gold to retest 1922. We generally favor the overall bearish trend unless we witness any trading above 1930.
Note: The risk level is high.
Note: Trading on CFDs involves risks. Therefore, all scenarios may be possible. This article is not a recommendation to buy or sell but rather an explanatory reading of the price movement on the chart.
| S1: |