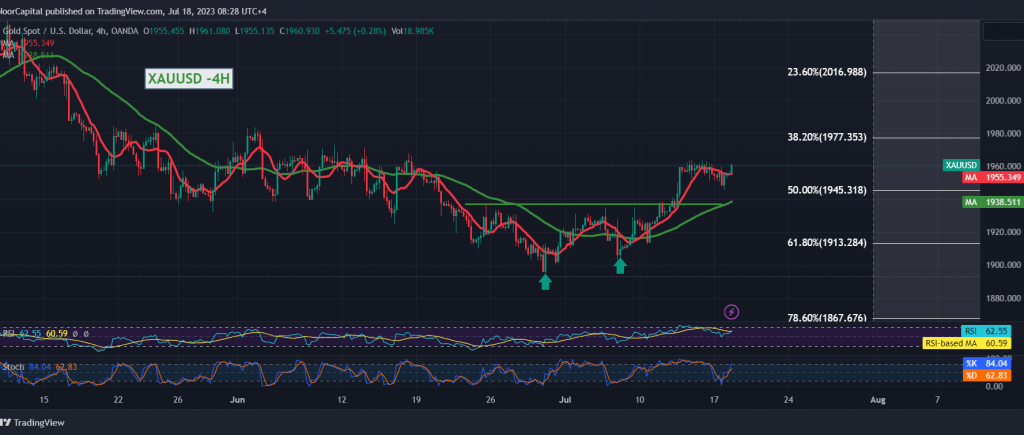
Gold prices are witnessing a quiet upward rise within the bullish path published during the previous technical analysis, gradually approaching the 1970 target to record its current high during the morning trading of today’s session 1961.
Technical View Today, gold prices achieved a typical re-test of the main support floor located at the price of 1945, represented by Fibonacci correction 50.0%, to force gold to rebound bullishly. The simple moving averages still support the possibility of a rise and the bullish technical formation shown on the time-lapse chart. 4 hours.
From here, with steadfast trading above the previously breached resistance, which is currently transformed into a support level, according to the concepts of the exchange of roles at the price of 1945, Fibonacci correction of 50.0%, the bullish trend is the most preferred, targeting 1970 and 1976 as initial targets that may extend later towards 1988 as an initial main station.
To remind you that closing at least an hourly candle below 1945 nullifies the activation of the suggested scenario, and the offending trend returns to control gold’s movements. We are witnessing a re-test of 1935 and 1913 61.80% correction.
Note: Today we are awaiting high-impact economic data issued by the US economy “retail sales” and from Canada, we await the “consumer price index” and we may witness high volatility at the time of the news release.
Note: Trading on CFDs involves risks. Therefore, all scenarios may be possible. This article is not a recommendation to buy or sell but rather an explanatory reading of the price movement on the chart.
| S1: |
 Noor Trends News, Technical Analysis, Educational Tools and Recommendations

