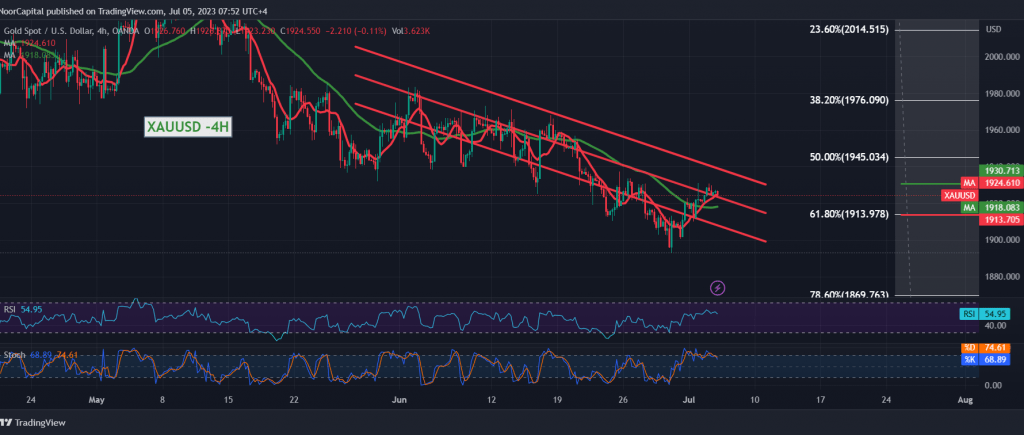
Gold prices are still facing selling pressures, and the previous session’s trading witnessed a retest of the pivotal resistance level at 1930, which gold prices have failed to cross upwards so far.
Technically, and with a closer look at the 4-hour chart, we find that the stochastic provides negative signals in favour of the daily bearish trend and the regularity of movement within the bearish channel.
From here, with steady daily trading below 1930, the bearish trend remains valid and effective, targeting 1913, the first target represented by the Fibonacci correction of 61.80%, knowing that breaking the mentioned level extends the losses to waiting for touching 1900 and 1887 as next stations.
We remind you that the price’s consolidation above 1930, with at least an hourly candle closing above 1930, will immediately stop the suggested bearish scenario, and gold prices will recover temporarily to retest 1945 50.0% correction.
Note: Today we are awaiting high-impact economic data issued by the US economy, “the Federal Reserve Committee statement,” and the “OPEC meeting”, and we may witness high volatility at the time of the news release.
Note: Trading on CFDs involves risks. Therefore, all scenarios may be possible. This article is not a recommendation to buy or sell but rather an explanatory reading of the price movement on the chart.
| S1: |
 Noor Trends News, Technical Analysis, Educational Tools and Recommendations

