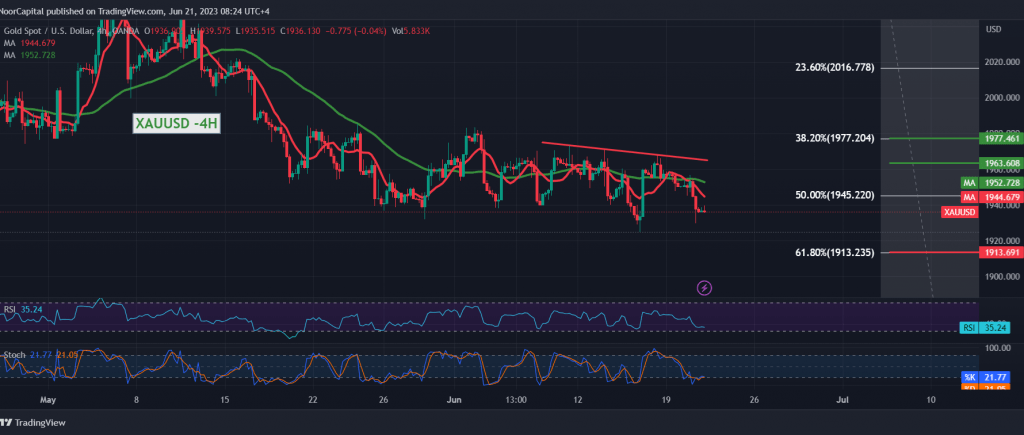
As we expected, gold prices declined during the previous trading session within the bearish context. We explained that breaking the main support level of 1945 puts gold prices under negative pressure to touch the first expected target of 1932, recording its lowest level at $1929 per ounce.
Technically, and by looking at the 4-hour chart, we find that the simple moving averages constitute an obstacle in front of the price, in addition to trading stability below the broken support of 1945 represented by Fibonacci correction 50.0%.
Therefore, we maintain our negative outlook, targeting 1924 next, knowing that the official target to break the main support for the current trading levels is around 1913, 61.80% correction. It should be noted that the breach of 1913 increases and accelerates the strength of the bearish trend so we are waiting to touch the next station at 1897.
From above, price consolidation above 1963 leads gold prices to retest 1970. In general, we continue to suggest the overall bearish direction as long as trading remains stable below the main resistance of the current trading levels of the 1978 correction of 38.20%.
Note: Today, we await high-impact economic data issued by the British economy, the annual “consumer price index”, and “the testimony of the Federal Reserve Chairman” on the semi-annual monetary policy report before the House Financial Services Committee. We may witness a high price fluctuation during the news release.
Note: Trading on CFDs involves risks. Therefore, all scenarios may be possible. This article is not a recommendation to buy or sell but rather an explanatory reading of the price movement on the chart.
| S1: |
 Noor Trends News, Technical Analysis, Educational Tools and Recommendations

