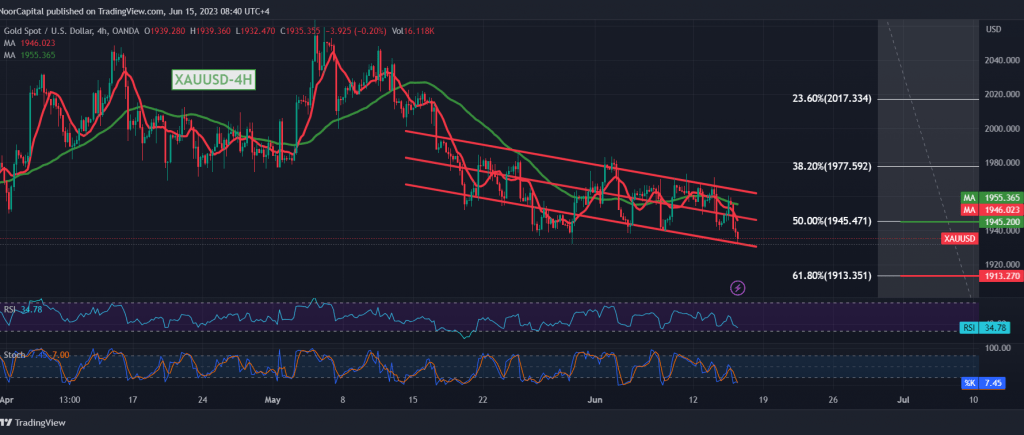
For several consecutive sessions during the current week’s trading, we have committed ourselves to remain neutral due to the movements of gold prices in a confined sideways price range, from the bottom above 1945 and from the top below 1977, explaining that the activation of selling positions begins with a break of 1945, so that gold prices begin with negative pressure on the level above, recording the lowest level During the morning trading of the current session, it has $1932 per ounce.
Technically, gold prices surrendered to trading below the previously broken strong support floor at 1945, represented by the 50.0% Fibonacci correction and the negative intersection of the simple moving averages supporting the bearish price curve.
Therefore, we maintain our negative outlook towards the targets of the previous report 1924/1927 preliminary targets, considering that the official target for the 1945 breakout is located around 1913 correction of 61.80%.
From above, price consolidation above 1958 leads gold prices to retest 1970. In general, we suggest the overall bearish trend as long as trading is stable below the primary resistance of the current trading levels 1978.
Note: Today we are awaiting high-impact economic data issued by the US economy “consumer price index” and from the United Kingdom “Bank of England governor’s speech,” and we may witness high volatility at the time of the news release.
Note: Trading on CFDs involves risks. Therefore, all scenarios may be possible. This article is not a recommendation to buy or sell but rather an explanatory reading of the price movement on the chart.
| S1: |
 Noor Trends News, Technical Analysis, Educational Tools and Recommendations

