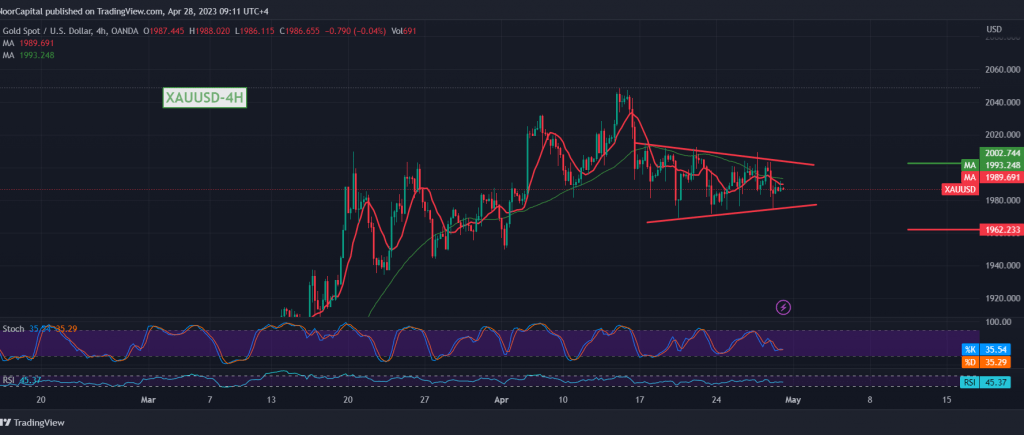
Negative trading dominated gold prices yesterday, explaining that the failure to breach the pivotal resistance level 2006 increases the possibility of the corrective decline to target 1985 and 1971, recording its lowest level at $1972.00 per ounce.
Today’s technical vision indicates the possibility of continuing the decline, depending on the stability of trading below 2002, in addition to the beginning of pressure on the support of the symmetrical 1980, as shown on the 4-hour chart.
The possibility of a decline exists and is effective by breaking the support floor of 1980, targeting 1973 as the first target, and then 1962, respectively. However, care must be taken around 1962 due to its importance to the general trend in the short term, and breaking it increases and accelerates the corrective decline, towards 1952 target.
The upside move and price consolidation above 2002 invalidates the proposed scenario and leads gold prices to recover temporarily towards 2018.
Note: the risk level may be high today.
Note: Trading on CFDs involves risks. Therefore, all scenarios may be possible. This article is not a recommendation to buy or sell but rather an explanatory reading of the price movement on the chart.
| S1: |
 Noor Trends News, Technical Analysis, Educational Tools and Recommendations

