
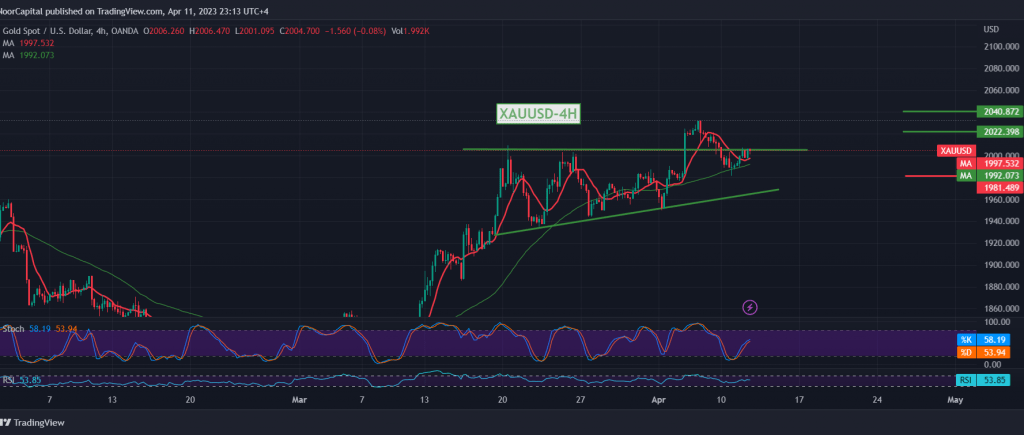
A quiet, gradual rise dominated gold prices during the previous trading session’s dealings within the targeted bullish path, touching the first target to be achieved yesterday at the price of 2004, recording the highest of $2007 per ounce.
Technically, and with a closer look at the 240-period chart, we find that gold prices are still stable above 1985, as it established a good support ground around 19800. The 50-day simple moving average supports the possibility of rising again. The stochastic indicator tries to gain enough additional momentum to push the price higher.
With the stability of intraday trading above 1980, the bullish scenario remains valid and effective, knowing that the breach of 2008 and the consolidation of the price above it is a catalyst factor that enhances the chances of touching 2014 and then 2023, an initial official station for the current trend, and the gains may extend later towards 2040.
Closing below 1980 puts gold under rapid negative pressure, targeting 1966 and 1960 respectively. In general, we suggest the overall bullish trend as long as trading remains stable above 1960, representing the key to protecting the bullish trend in the short term.
Note: the risk level may be high.
Note: Today we are waiting for high-impact economic data issued by the US economy: the results of the Federal Reserve Committee meeting, “consumer price index” and from the Canadian economy, we await ” the interest of the Bank of Canada and the press conference of the Bank of Canada” in addition to “the speech of the Governor of the Bank of England”. We may witness high volatility at the time of the news release.
Note: Trading on CFDs involves risks. Therefore, all scenarios may be possible. This article is not a recommendation to buy or sell but rather an explanatory reading of the price movement on the chart.
| S1: |