
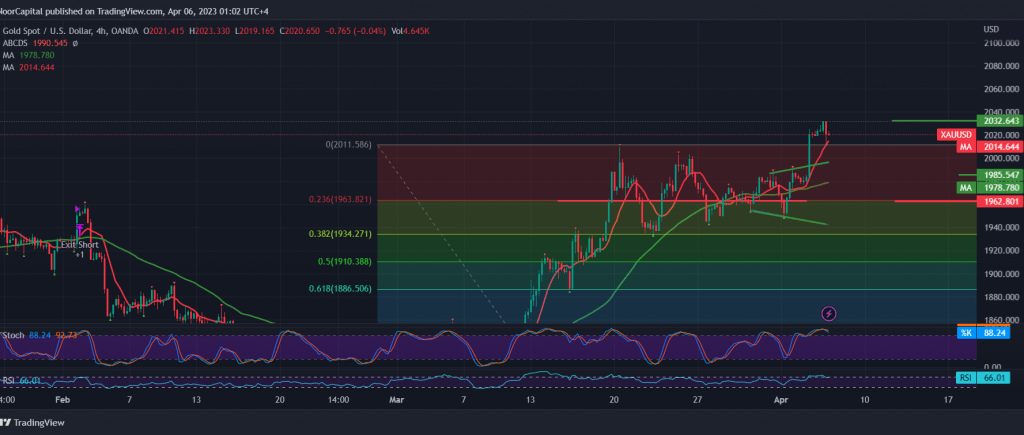
Trading tended to be positive and continued to control the prices of the yellow metal during the previous trading session as part of a gradual rise towards the target of the previous report at the price of 2040, to suffice with recording the highest $2032 per ounce.
Technically, and with a closer look at the 240-period chart, we find that gold prices are still stable above the previously breached resistance in 2010, and we find the 50-day simple moving average still supports the bullish curve of prices. We are witnessing some fluctuation until we get the official trend
The ability of gold prices to stay above the 2010 level increases the possibility of continuing the rise to complete the bullish directional movement towards 2040/2042, an awaited station. However, we are satisfied with this goal only until the next price destination is determined.
The decline below 2010 puts the price under negative pressure to retest the 1987 and 1962 38.20% correction.
Note: the risk level may be high.
Note: Trading on CFDs involves risks. Therefore, all scenarios may be possible. This article is not a recommendation to buy or sell but rather an explanatory reading of the price movement on the chart.
| S1: |