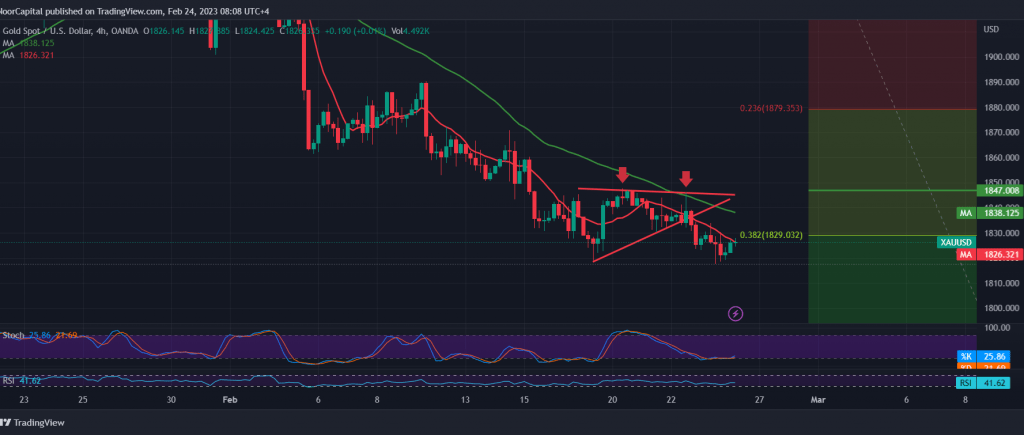
Gold prices were able to resume the correctional decline, as we expected, touching the target to be achieved in the previous technical report at the price of 1818, in which we relied on confirming the break of 1828.
Technically, by looking at the 240-minute chart, we find the 50-day simple moving average continues to pug pressure on the price from above, and it meets near the previously broken support, which is now converted to the resistance level of 1829, Fibonacci correction 38.20%, and the relative strength index is stable below the 50 center line.
From here, with steady daily trading below 1830, and most importantly 1833, that encourages us to keep our expectation for the continuation of the corrective decline, knowing that breaking 1817 facilitates the task required to visit 1809 and 1800, respectively, knowing that the next official target for the corrective drop wave is located around 1788, correction of 50.0%.
Rising above 1833 postpones chances of a decline but does not cancel them, and we may witness a re-test of 1841 and 1850 before the start of the decline again.
Note: Today we are awaiting important economic data issued by the US economy’s “primary personal consumption expenditure,” and we may witness a high fluctuation in prices at the time of the news release.
Note: Trading on CFDs involves risks. Therefore, all scenarios may be possible. This article is not a recommendation to buy or sell but rather an explanatory reading of the price movement on the chart.
| S1: |
 Noor Trends News, Technical Analysis, Educational Tools and Recommendations

