
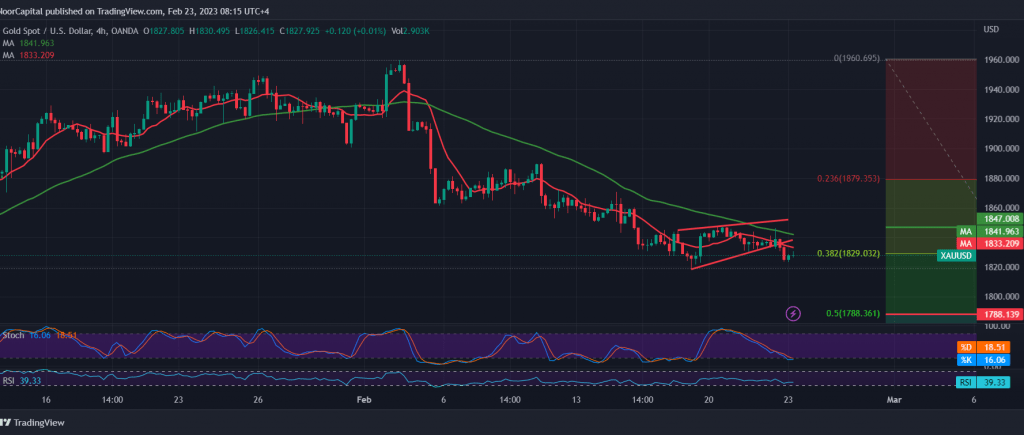
A bearish trend continues to control gold prices, constantly pressurized by the rise of its American rival. As a result, it is heading to touch the first official target station during the previous analysis, at 1828, recording its lowest level at $1823 per ounce.
The technical analysis today indicates the possibility of continuing the decline as a result of the continuation of the negative intersection of the simple moving averages, which continues to exert negative pressure on the price from above, and this comes in conjunction with the clear negative signs on Stochastic, which is stimulated by the limited momentum.
Therefore, the bearish scenario will remain valid towards the targets of the previous report 1818 and 1809 expected targets, knowing that the next official target for the current bearish wave is around 1788, Fibonacci correction 50.0%.
Trading stability and the price’s consolidation again above 1850, and most importantly 1855, postpones the downside chances but does not cancel them. We may witness a temporary bullish tendency, which aims to retest 1865 initially.
Note: Today, we are awaiting quarterly the preliminary reading of the gross domestic product in the US, and we may witness a high fluctuation in prices at the time of the release.
Note: Trading on CFDs involves risks. Therefore, all scenarios may be possible. This article is not a recommendation to buy or sell but rather an explanatory reading of the price movement on the chart.
| S1: |