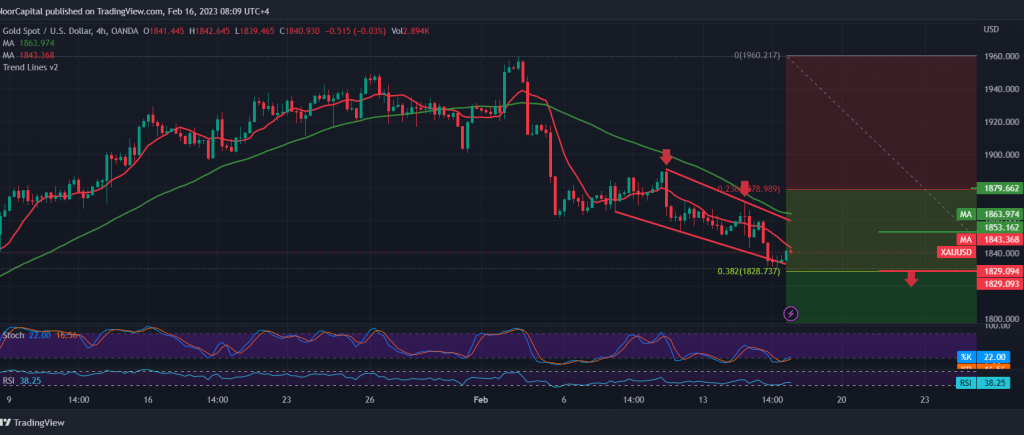
A bearish trend, as we expected, dominated gold prices, touching the first target to be achieved at the price of 1838, and approaching by a few points from the official target station 1828, recording its lowest level at 1830.
Technically, by looking at the 240-minute chart, the stochastic is trying to gain additional momentum. However, the signals are still weak, and we notice the negative pressure from the simple moving averages that continue to exert pressure on the price from above, stimulated by the decline in momentum.
From here, with steady daily trading below 1852, and most notably 1856, that encourages us to keep our negative expectations, targeting 1828, Fibonacci correction 38.20%, an awaited station, and the price should be closely monitored around this level due to its importance to the general trend in the medium term, and breaking it clears the way towards the bearish correction to visit 1813 and 1788.
Trading stability and the price’s consolidation above 1856 postpone the chances of a decline but does not cancel them, and we may witness a limited bullish tendency aimed at retesting 1871.
Note: Today we are awaiting high-impact economic data issued by the US economy, “the monthly producer price index,” and we may witness high volatility at the time of release.
Note: Trading on CFDs involves risks. Therefore, all scenarios may be possible. This article is not a recommendation to buy or sell but rather an explanatory reading of the price movement on the chart.
| S1: |
 Noor Trends News, Technical Analysis, Educational Tools and Recommendations

