
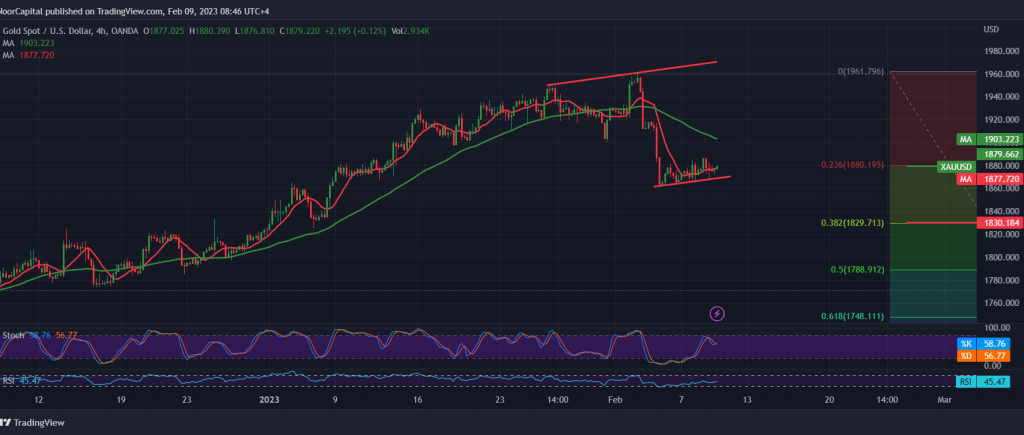
Gold prices found a strong resistance level around the level published during the previous technical report at 1885, which forced gold prices to maintain the bearish context, to return once again to test the 1869 support level.
Closer looking at the chart, we find the movements confined between 1870 and 1885, and the intraday movements are witnessing stability below 1880, the strong resistance of 23.60% Fibonacci correction. We find that stochastic started to lose bullish momentum gradually.
We keep our negative expectations, provided that we witness a clear and strong break of the 1870 support floor, which facilitates the task of resuming the bearish trend, as we are waiting to touch the first target 1860 and 1854, respectively. As a reminder, the official target for the current bearish wave is still located at 1829, Fibonacci correction 38.20%.
Activating the scenario suggested above depends on the stability of the price below 1886/1885, and breaching it postpones the chances of a decline but does not cancel them. We may witness an upward trend that aims to re-test 1894 and 1900 before the start of the decline again.
Note: Trading on CFDs involves risks. Therefore, all scenarios may be possible. This article is not a recommendation to buy or sell but rather an explanatory reading of the price movement on the chart.
| S1: |