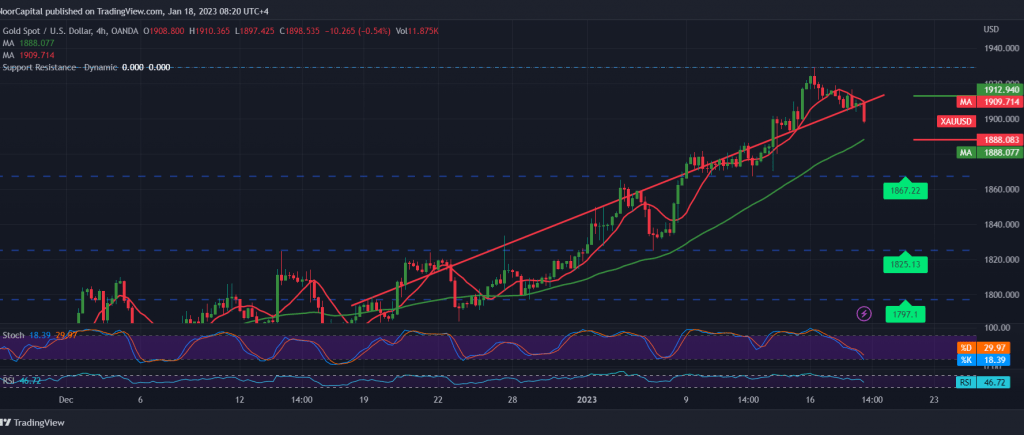
Negative trading dominated gold prices during the previous trading session, as we indicated in the last report, touching the first target of 1903, and heading for the second target 1897 during the morning trading of the current session.
Technically, and by looking at the 4-hour chart, we notice the stability of trading below 1903, and the 10-day simple moving average started to pressure the price from above. This coincides with the decline in momentum over the short-term intervals.
Therefore, the possibility of continuing the decline within the correctional decline is still present, targeting 1887/1889 as a first target. It must be carefully noted that breaking 1887 leads gold prices to visit 1867.
From above, the return of trading stability above 1911 cancels the activation of the suggested scenario completely, and gold regains the main bullish path, to be waiting for an ounce of gold around 1926 and 1933 initially.
Note: High-impact data are due today, UK Annual Consumer Prices, US Retail Sales and US Producer Prices and may cause some volatility.
Note: Trading on CFDs involves risks. Therefore, all scenarios may be possible. This article is not a recommendation to buy or sell but rather an explanatory reading of the price movement on the chart.
Note: Trading on CFDs involves risks. Therefore, all scenarios may be possible. This article is not a recommendation to buy or sell but rather an explanatory reading of the price movement on the chart.
| S1: |
 Noor Trends News, Technical Analysis, Educational Tools and Recommendations

