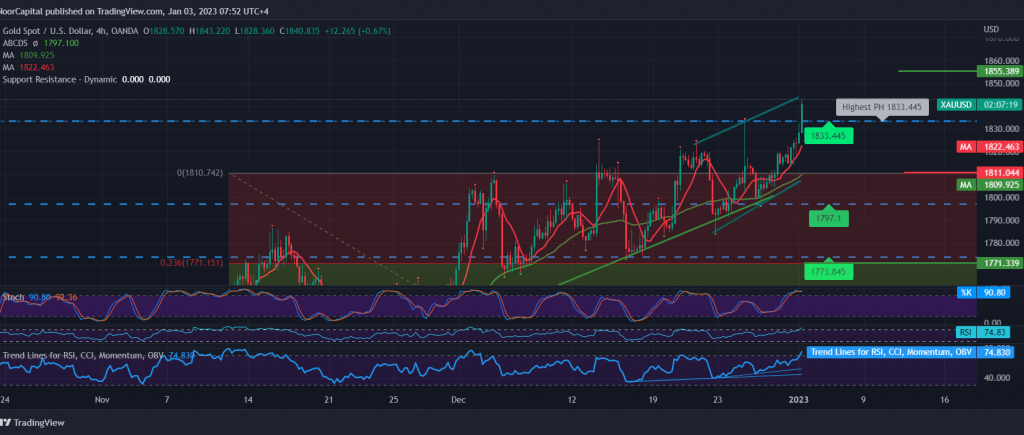
Gold prices opened their first annual transactions with a noticeable increase within the expected upward path during the last report. As a result, we targeted the 1824 level, recording its highest level during the morning trading of today’s session at 1848.
Technicals indicate the possibility of resuming the upward path, relying on price stability above the 50-day simple moving average, which supports the daily bullish price curve, and meets around the support level of 1810, adding more strength to it, in addition to the positive signs coming from the momentum indicator and its stability above the mid-line 50.
Therefore, the bullish scenario is the most likely, targeting 1850/1848 as an initial official station. However, we must be careful that its breach increases and accelerates the strength of the bearish daily trend, to be waiting for 1855 and 1860, respectively. The gains may extend later towards 1868.
Only from below, stability and the stability of the price below 1810 leads gold prices to retest 1797 before they attempt to rise again.
Note: Trading on CFDs involves risks. Therefore, all scenarios may be possible. This article is not a recommendation to buy or sell but rather an explanatory reading of the price movement on the chart.
| S1: |
 Noor Trends News, Technical Analysis, Educational Tools and Recommendations

