Trading tended to be negative within a narrow path that dominated gold’s movements with the beginning of this week’s trading. As a reminder, we preferred to monitor the price behavior, explaining that we are waiting for a direction confirmation signal.
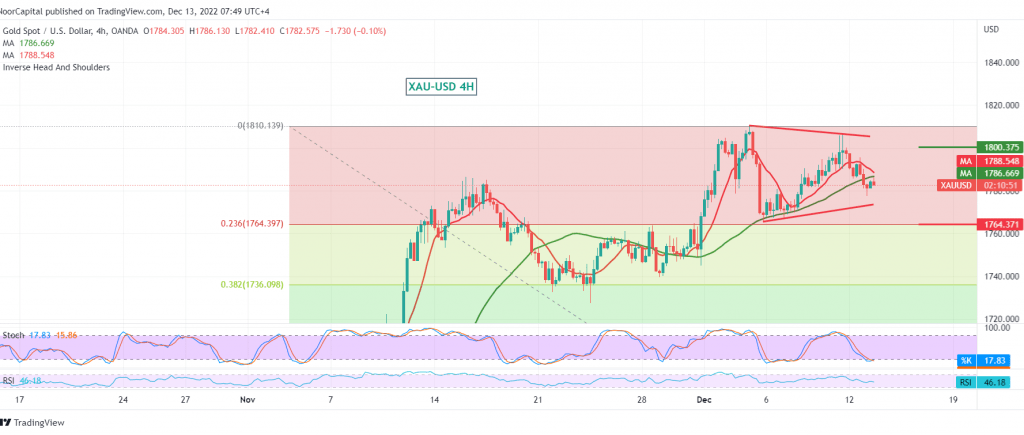
Technically, and by looking at the 240-minute chart, we notice the beginning of negative pressure from the simple moving averages, in addition to the stability of intraday trading below 1794 and in general below 1800, which increases the possibility of a decline, on the other hand, we find the stochastic indicator around overbought areas It is accompanied by intraday stability above the support level of 1780.
With conflicting technical signals, we prefer to monitor the price behavior for the second session in a row, in order to obtain a high-quality deal, to be in front of one of the following scenarios:
The downside trend requires that we witness a clear break of the 1780 support level, which facilitates the task required to visit 1774 and 1764, respectively. Care must be taken if 1764 retracement of 23.60% is touched, given the importance of this level in relation to the general trend in the short term.
To get an upward trend, that depends on skipping upwards and consolidating above 1800, which is a catalyst that enhances the chances of a rise towards 1805 and 1814. Initial targets may extend later towards $1820.
Today we are awaiting high-impact economic data, and we may witness fluctuations at the time of news release:-
- The consumer price index from the United States of America is one of the most important measures of inflation and has an impact on the interest rate decision.
– Change in unemployment benefits from the UK, Bank of England Governor’s Speech.
Note: Trading on CFDs involves risks. Therefore, all scenarios may be possible. This article is not a recommendation to buy or sell but rather an explanatory reading of the price movement on the chart.
| S1: |
 Noor Trends News, Technical Analysis, Educational Tools and Recommendations

