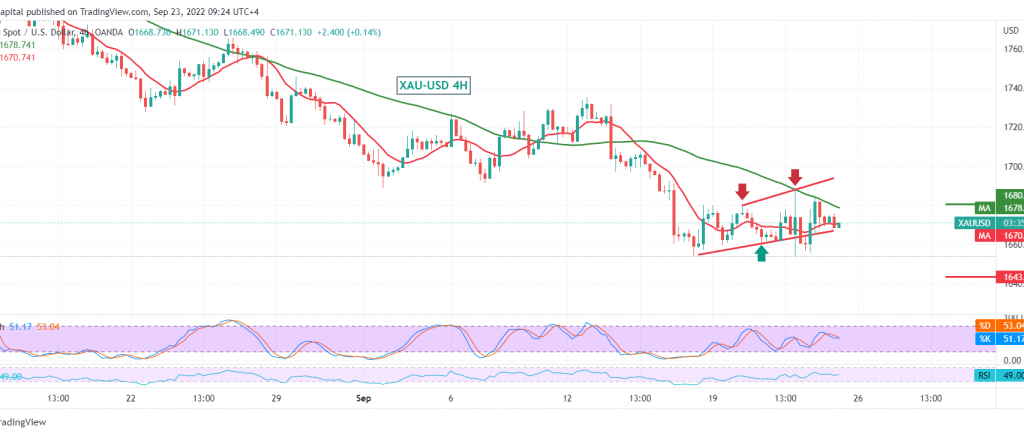
The solid resistance levels mentioned during yesterday’s technical report, located at 1680, could limit the bullish bias that occurred during the previous session to make gold fail, explaining that it represents the key to protecting the bearish trend.
Technically, the current moves are witnessing stability below 1680, accompanied by the negative pressure of the 50-day simple moving average, which constitutes an obstacle in front of the price, motivated by the clear negative features on the stochastic indicator.
On the other hand, the price is stable above 1655, and we find the 14-day momentum indicator started to get positive signs on the short time intervals, supporting the possibility of a bullish bias in the coming hours.
With technical signals conflicting, we need to monitor price behavior to be in front of one of the following scenarios:
To complete the bearish directional movement, we need to witness a clear and strong break of the pivotal demand area 1665 and then 1655. This facilitates the task required to visit 1640 initially, and losses may extend later towards 1637.
To get the start of a minor bullish correction that depends on stability above 1683/1680, we wait for an ounce of gold around 1698 and 1705.
Note: The risk level may be high.
Note: We are awaiting the Federal Reserve’s speech later in today’s session and may witness high price volatility.
Note: Trading on CFDs involves risks. Therefore, all scenarios may be possible. This article is not a recommendation to buy or sell but rather an explanatory reading of the price movement on the chart.
| S1: |
 Noor Trends News, Technical Analysis, Educational Tools and Recommendations

