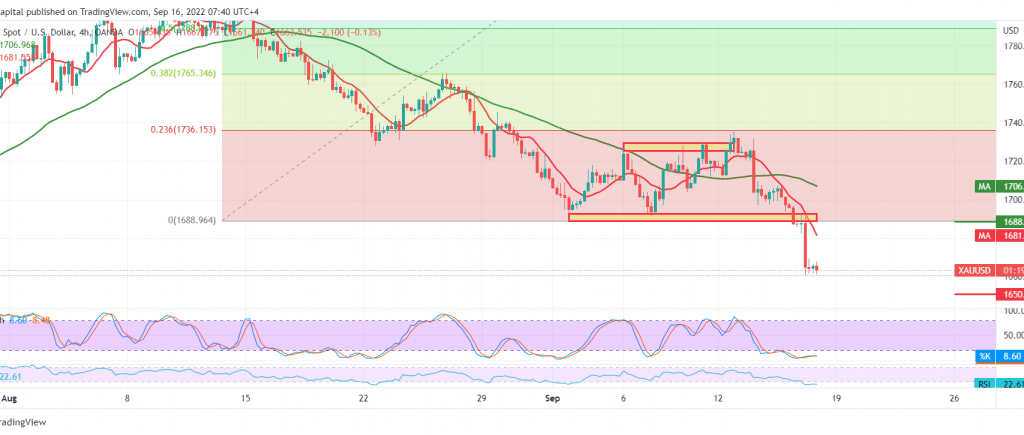
Gold prices incurred heavy losses yesterday amid selling within the bearish directional movement, as we expected, bypassing the official target station 1680, heading near the next station 1650, to settle for its lowest level at $1660 per ounce.
On the technical side, the simple moving averages still support the daily bearish price curve, and we find that gold achieved a clear break of the 1680 support level, which is now turned into a resistance level as shown on the chart, in addition to the bearish momentum signal.
Therefore, the possibility of continuing the decline is the most likely, knowing that breaking 1660 facilitates the task required to initially visit the second official leg of the current descending wave at 1650. We are satisfied with this target due to its importance to the current trading levels and the general trend in the medium term.
Rising above 1687 may postpone the chances of a decline, and we will witness a temporary recovery of the gold price to retest 1700 and 1710.
Note: Stochastic is around overbought areas.
Note: a close below 1650 exposes gold prices to a sharp decline that may target around $1635 per ounce.
Note: Trading on CFDs involves risks. Therefore, all scenarios may be possible. This article is not a recommendation to buy or sell but rather an explanatory reading of the price movement on the chart.
| S1: |
 Noor Trends News, Technical Analysis, Educational Tools and Recommendations

