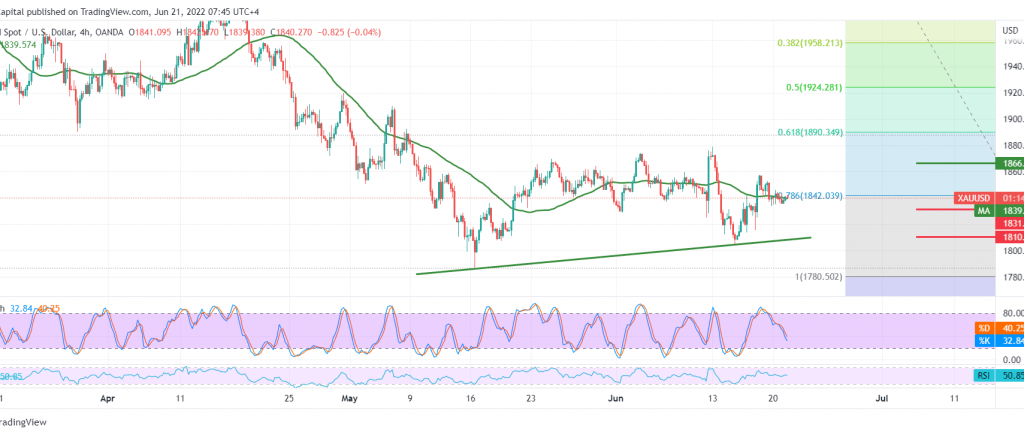
Gold prices found a good support level around 1833 over several consecutive sessions, unable to break the mentioned level, trying to hold on to its ascending path, and it is now hovering around its highest level during the early morning trading of 1840.
On the technical side, stochastic is trying to eliminate the current negativity on the 4-hour time frame. We find the 50-day moving average trying to hold the price from below, supporting an upward bias during the session.
We tend to be positive but cautiously; we only wait to cross above and consolidate above 1845, which is a catalyst to open the way for gold prices to record gains that start at 1853 and 1866, initial targets that may extend later to visit 1876 as long as the price is stable above 1830.
Any attempt to break the bottom of 1830 will lead gold to enter a solid descending wave, targeting 1807 and 1800 initially.
Note: the momentum indicator is negative on the short time frames.
Note: Trading on CFDs involves risks. Therefore, all scenarios may be possible. This article is not a recommendation to buy or sell but rather an explanatory reading of the price movement on the chart.
| S1: |
 Noor Trends News, Technical Analysis, Educational Tools and Recommendations

