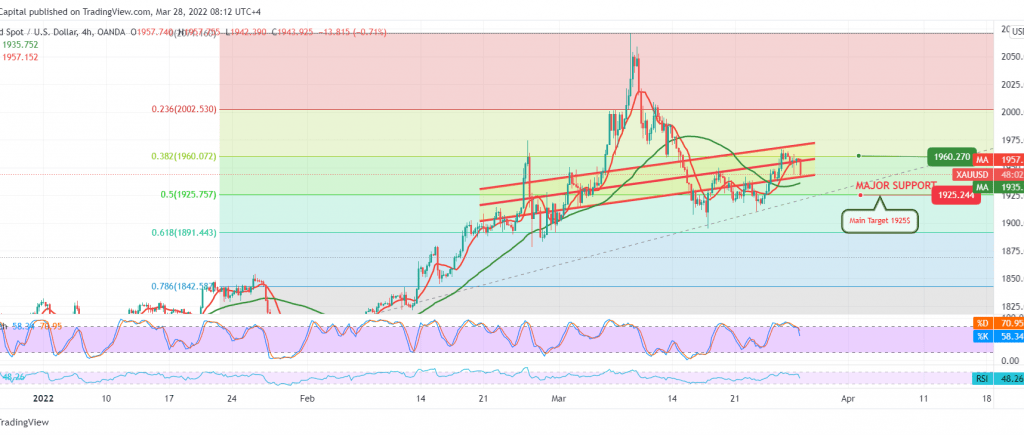
The 1964 resistance levels limited the bullish bias, which formed strong supply areas that forced gold prices to retest the previously breached resistance-into-support level around 1942.
On the technical side, the current gold movements are witnessing stability around the lowest level during the Asian session, around 1942, and by looking at the 4-hour chart, we notice the clear negative signs on stochastic and losing the bullish momentum, in addition to the stability of trading below 1960, the 38.20% Fibonacci correction.
The daily trend may be inclined to the downside to visiting the first bearish target 1936, knowing that the official target for today’s session lies around the main support for the current trading levels 1925, 50.0% correction as shown on the chart as long as the price is stable below 1960.
Note: Trading on CFDs involves risks. Therefore, all scenarios may be possible. This article is not a recommendation to buy or sell but rather an explanatory reading of the price movement on the chart.
| S1: |
 Noor Trends News, Technical Analysis, Educational Tools and Recommendations

