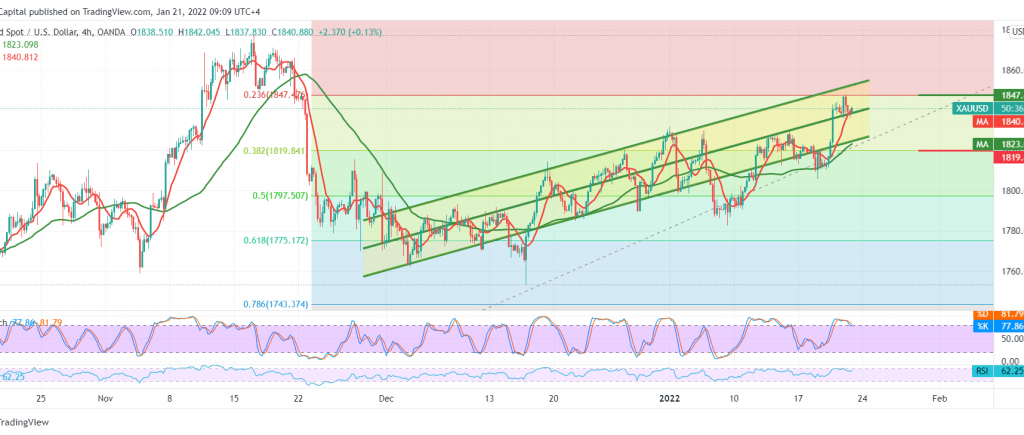
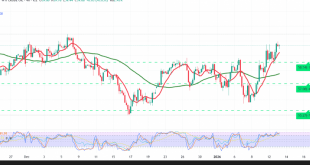
The yellow metal prices found a strong resistance level at 1847, which we mentioned during the previous analysis that breaching it is a basic and important condition to continue the rise.
Technically, the intraday movement of gold is witnessing stability below the mentioned resistance. However, by looking at the 4-hour chart, we notice the negativity signs that have started appearing on the stochastic indicator and started losing the bullish momentum.
Therefore, there may be a possibility of temporary negative movements aimed at retesting 1830 and 1824 before any attempts to rise again, knowing that the above-suggested scenario does not contradict the bullish trend with targets around 1852 and 1857 once 1847 is breached.
Note: CFD trading involves risks; all scenarios may occur.
| S1: 1835.00 | R1: 1846.00 |
| S2: 1830.00 | R2: 1852.00 |
| S3: 1824.00 | R3: 1865.00 |
 Noor Trends News, Technical Analysis, Educational Tools and Recommendations

