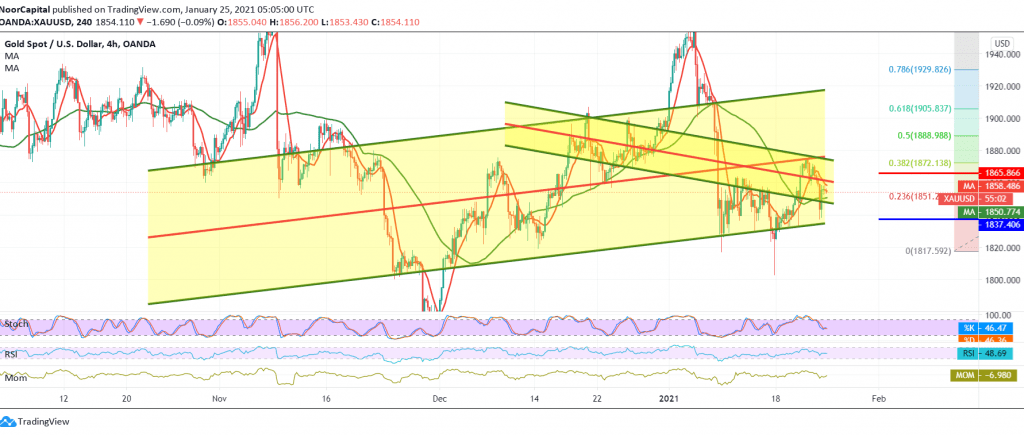
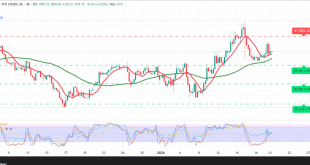
Negative trading dominated gold price movements during last Friday’s session, heading to touch the official target at 1838.
Technically, gold found a good support floor around 1837, to witness a re-test of 1854.
Looking at the 60-minute chart, we find that the 50-day moving average is trying to push the price up, accompanied by the beginning of positive signs appearing on the RSI.
Despite the technical factors that support the possibility of the bullishness, we prefer to wait until confirming the breach of 1865, and this is a catalyst that enhances the chances of an upside move towards 1872, a 38.20% correction, a first target and it may extend to 1875.
If the price fails to surpass the upside and stabilizes above 1865 and returns to trade again below 1838, that forces the price to enter a strong descending wave, with initial target 1820, while its official target is around 1800.
| S1: 1837.00 | R1: 1870.00 |
| S2: 1820.00 | R2: 1885.00 |
| S3: 1805.00 | R3: 1903.00 |
 Noor Trends News, Technical Analysis, Educational Tools and Recommendations

