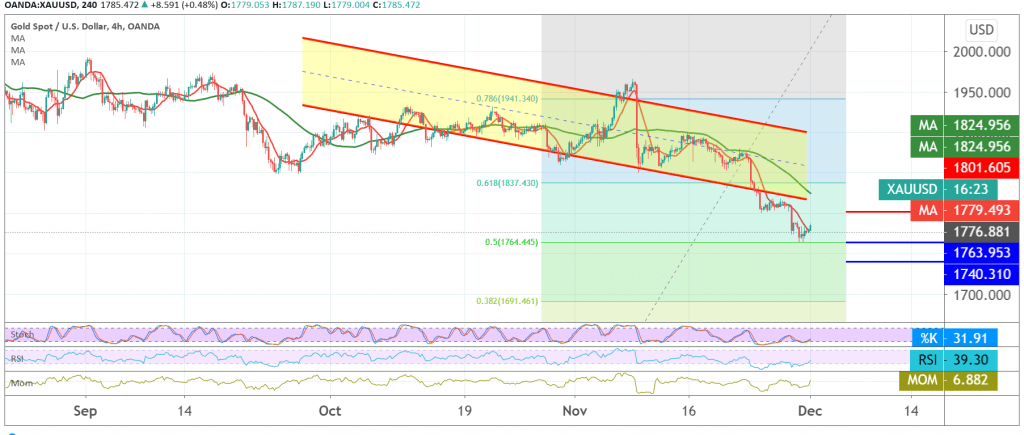
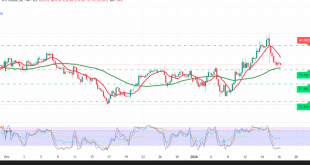
Negative trading dominated gold prices with the opening of the first weekly trading to record its lowest level at 1764. Technically, by looking at the 4-hour chart, the pair found support floor around 1965 as we find on the short timeframe that RSI is starting to get positive signals.
From here, we believe that there is a possibility of a slight upward corrective tendency within the downside slope, targeting a re-test of the previously broken support level, which turned into a resistance level at 1800.
Activating the temporary bullish scenario requires stability above 1764 represented by the 50.0% Fibonacci retracement because breaking it leads gold to continue the trend. The daily bearish day with initial targets starting at 1754 and extending to 1745.
| S1: 1770.00 | R1: 1794.00 |
| S2: 1754.00 | R2: 1804.00 |
| S3: 1745.00 | R3: 1820.00 |
 Noor Trends News, Technical Analysis, Educational Tools and Recommendations

