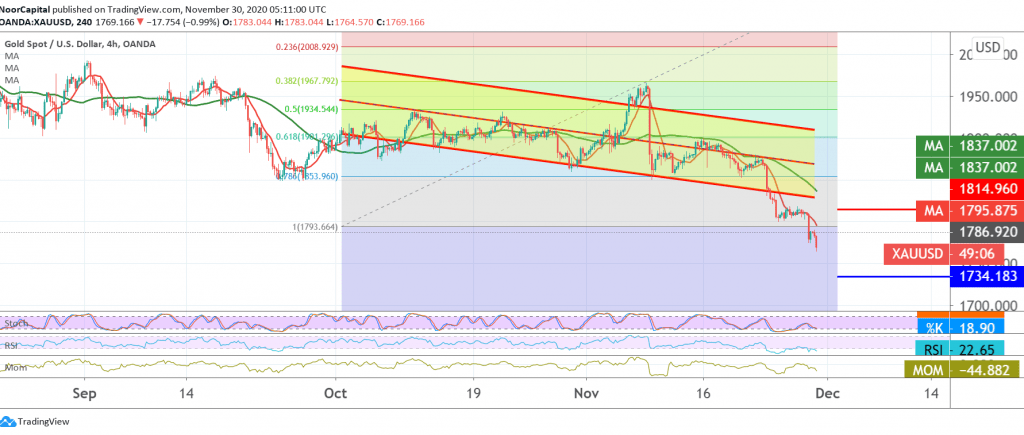
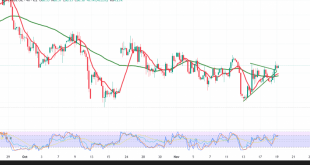
Heavy selling continues to control gold prices within a short-term downward correction trend touching the target to be achieved last Friday 1787, posting its lowest transactions with the opening of the current week’s trading in 1764 early this week.
On the technical side, and by looking at the chart at a 240-charts, we find the 50-day simple moving average continues to exert negative pressure on the price from the top, and the RSI indicator is stable below the 50 midlines.
With the stability of trading below the support level of the psychological barrier 1800, which was previously broken and now converted into a resistance level according to the concept of role-play. next station.
From the top, the return of trading to stability above 1800 and more importantly 1805, this may delay the chances of a decline, but not eliminate it, and we will witness a re-test of 1815.
| S1: 1750.00 | R1: 1800.00 |
| S2: 1733.00 | R2: 1830.00 |
| S3: 1702.00 | R3: 1850.00 |
 Noor Trends News, Technical Analysis, Educational Tools and Recommendations

