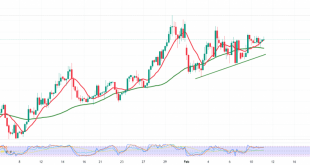
Gold prices were subjected to intense selling during the previous session within the expected bearish, in which we relied on the stability of intraday trading below 1925 in general below 1935, indicating that we are waiting for a bearish correction targeting 1890 and 1895 to post low of 1822 in early trading.
Technically, looking at the 4-hour chart, we find that the simple moving averages continue to put negative pressure on the price and support the bearish slope, in addition to trading stability below the pivotal resistance 1901, 61.80% Fib.
We will keep our negative expectations targeting 1875, noting that the official target for the current downside wave is around 1860.
From the top, and with trading stabilizing again above 1901 and most importantly 1910, the daily bearish trend will stop, and we will witness a test of previously broken support-into-resistance at 1935/1934, a 50.0% Fib.
Warning: the RSI indicator started to provide positive signals on short intervals and may push gold to rise intraday towards 1901, which does not contradict the bearish daily trend.
| S1: 1875.00 | R1: 1918.00 |
| S2: 1857.00 | R2: 1943.00 |
| S3: 1832.00 | R3: 1961.00 |
 Noor Trends News, Technical Analysis, Educational Tools and Recommendations

