GBP/USD Technical Analysis
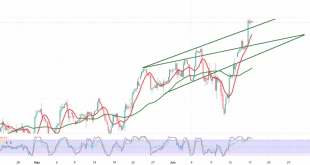
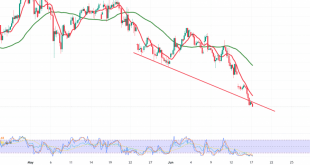
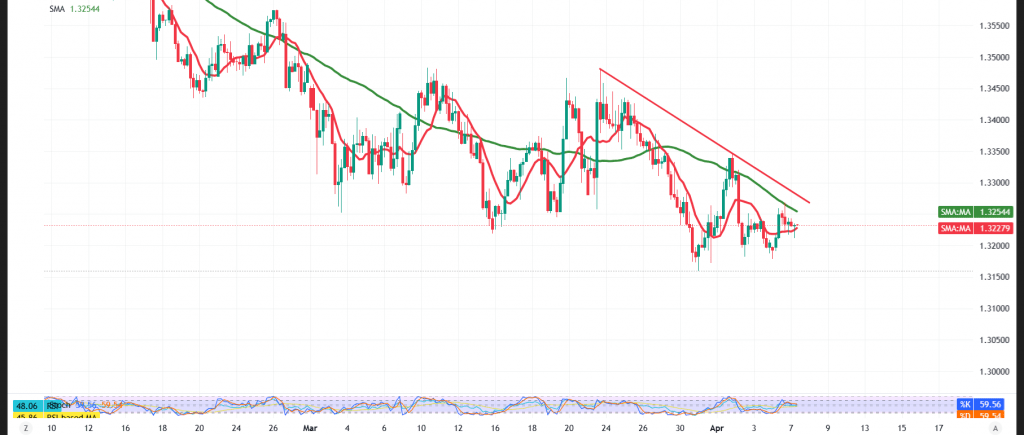
Bearish pressure has returned to dominate GBP/USD price action after the pair ran into simple moving average resistance, forcing the formation of a downward trend.
Technical Outlook
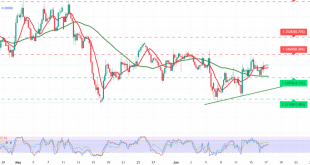
The simple moving averages continue to exert downward pressure from above, with the 50-day moving average converging near the 1.3260 resistance level — further reinforced by clearly bearish signals on the RSI, painting a consistently negative technical picture.
Key Levels to Watch
As long as price holds below 1.3270 on a daily closing basis, the bearish bias remains the most likely scenario, targeting 1.3185 as a first objective. A break below that level would extend losses toward 1.3140. On the other hand, a sustained recovery back above 1.3270 would neutralise the proposed bearish scenario and open the door for a temporary rebound toward 1.3315.
⚠️ Risk Warning: Trading carries a high level of risk amid ongoing trade and geopolitical tensions — all scenarios remain possible and sound risk management is essential.
Trading CFDs involves risks, and therefore all scenarios may be plausible. The information provided above is not a recommendation to sell or buy but rather an explanatory reading of price movement on the chart.
| S1: 1.3185 | R1: 1.3275 |
| S2: 1.3135 | R2: 1.3315 |
| S3: 1.3095 | R3: 1.3365 |