EUR/USD Technical Analysis — 4-Hour Chart
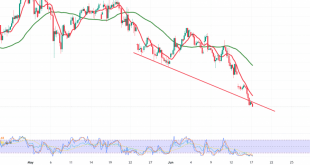
The EUR/USD pair has come under selling pressure in recent trading sessions after failing to sustain a foothold above the 1.1571 level, triggering the formation of a short-term bearish trend that is now dominating price action.
Technical Outlook
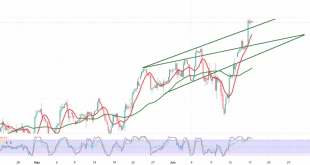
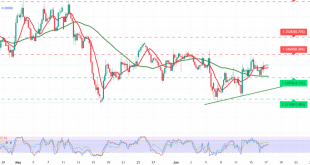
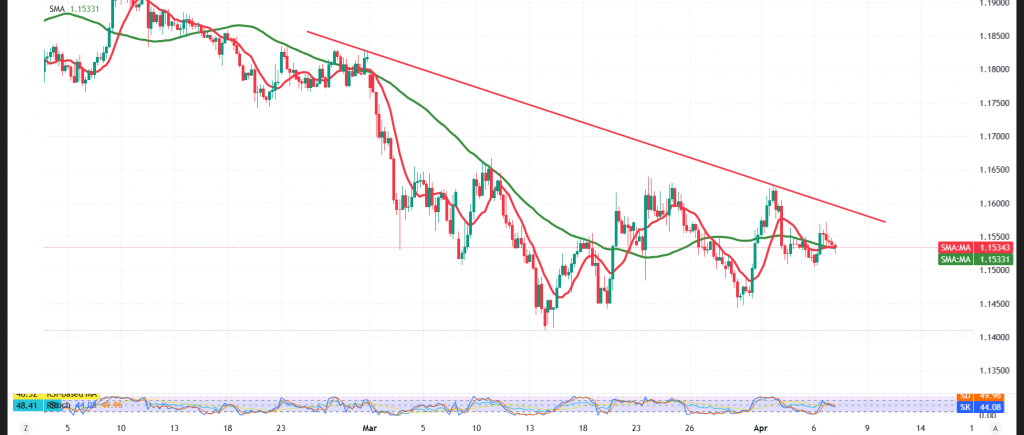
On the 4-hour timeframe, the pair continues to trade below its simple moving averages, which are acting as dynamic resistance and keeping downward pressure on price — reinforcing the near-term bearish bias.
Momentum indicators are adding to the bearish case, with the Relative Strength Index (RSI) showing clear signs of weakness, reflecting diminishing buying power. This aligns with price action trending along a descending trendline, lending further weight to continued selling pressure.
Key Levels to Watch
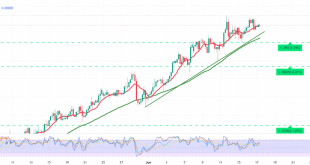
As long as the pair holds below the 1.1570 resistance level, the path of least resistance remains to the downside, with an initial target at 1.1500. A confirmed break below that level would open the door for an extended decline toward 1.1470.
On the flip side, an hourly candle close above 1.1570 would invalidate the bearish scenario and shift momentum to the upside, with 1.1605 as the first target on any recovery move.
Risk Disclaimer: Trading CFDs involves risks, and therefore the scenarios outlined above are not a recommendation to sell or buy but rather an explanatory reading of price movement on the chart.
| S1: 1.1500 | R1: 1.1570 |
| S2: 1.1470 | R2: 1.1605 |
| S3: 1.1440 | R3: 1.1640 |