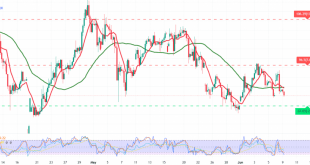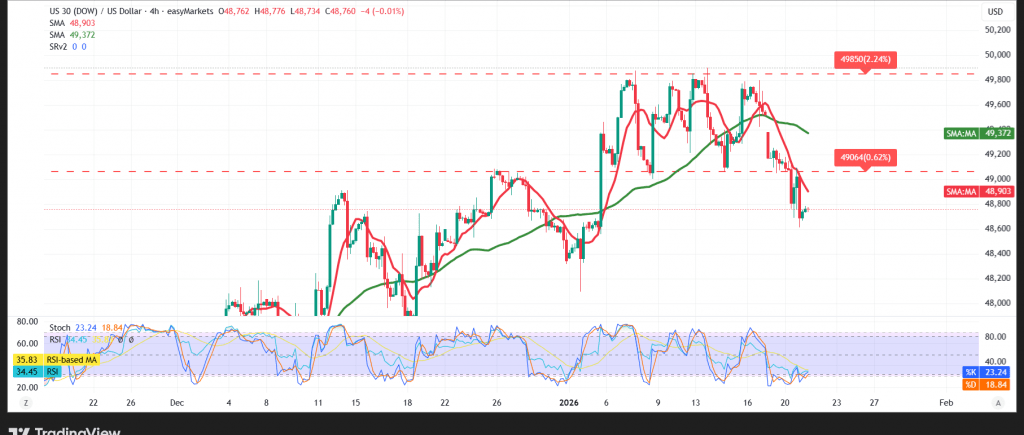
The Dow Jones Industrial Average gave up its recent gains, with the previous session dominated by selling pressure that pushed the index down to a low near 48,611.
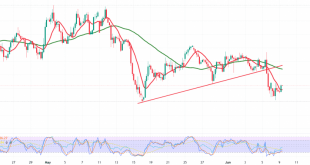
Technical Outlook – 4-Hour Chart
Price action remains capped below the simple moving averages, significantly reducing the likelihood of a near-term recovery. This bearish setup is reinforced by negative signals from the Relative Strength Index (RSI) on shorter timeframes, reflecting weakening momentum and persistent downside pressure.
Expected Scenario
As long as daily trading remains below the 49,000 resistance level — and more broadly beneath 49,050 — the downside scenario remains the most likely path for today. Under these conditions, the index is expected to target 48,550 initially, followed by 48,500, unless a clear return above 49,050 occurs.
Market Note:
Markets are awaiting statements from U.S. President Donald Trump today, which may trigger heightened volatility.
Risk Warning:
Market conditions remain high-risk amid ongoing trade and geopolitical tensions, and all scenarios remain possible.
Trading in CFDs involves risks, and therefore all scenarios are subject to potential outcomes. The analysis provided above is not a recommendation to buy or sell but rather an illustrative reading of price action on the chart.
| S1: 48550 | R1: 49050 |
| S2: 48325 | R2: 49335 |
| S3: 48040 | R3: 49550 |