
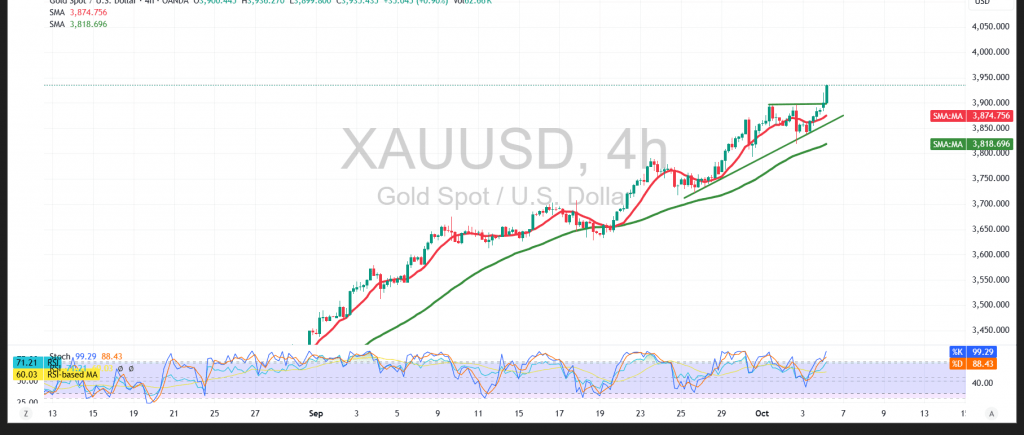
Gold prices continue to reach new record highs, starting the week with sharp gains during Asian trading, touching $3,933 per ounce.
Technical Overview:
- 50-Day Simple Moving Average (SMA): The price remains firmly above this level, providing dynamic support that continues to strengthen the bullish momentum.
- Relative Strength Index (RSI): Despite trading in overbought territory, the indicator maintains positive signals, reflecting the persistence of buying strength.
- Overall Structure: The general trend remains decisively bullish, with potential for further short-term gains.
Likely Scenario:
A confirmed break above $3,933 could open the path toward the next resistance zone near $3,963.
Conversely, temporary corrective pullbacks may occur before the price resumes its upward movement, particularly if it fails to consolidate above the recent peak.
Warning: The risk level remains high and may not be proportional to potential rewards.
Note: Risks are elevated amid ongoing trade and geopolitical tensions, and all scenarios remain possible.
Risk Disclaimer: Trading CFDs involves risks, and therefore all scenarios may be plausible. The content above is not a recommendation to sell or buy but rather an explanatory reading of price movement on the chart.
| S1: 3868.00 | R1: 3963.00 |
| S2: 3805.00 | R2: 3995.00 |
| S3: 3773.00 | R3: 4058.00 |


