
We previously maintained a neutral stance, emphasizing the need to monitor price behavior around the 2930 resistance level. A confirmed breakout above this level was expected to pave the way for a return to 2940, which was successfully achieved, marking a record high of $2940 per ounce.
Technical Analysis
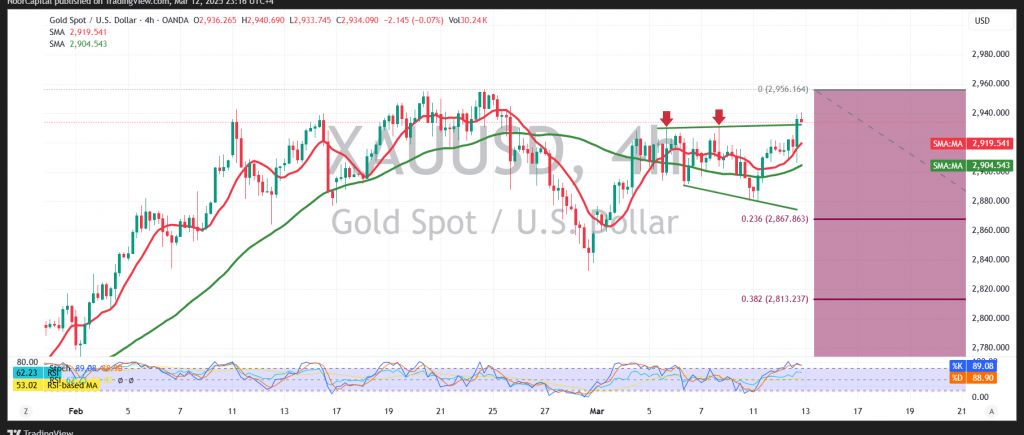
On the 4-hour chart, gold began attacking the 2930 resistance level during the previous U.S. trading session, gaining further upward momentum with support from the 50-day simple moving average.
If intraday trading stabilizes above 2930, and generally above 2915, the uptrend may continue, with the next target at 2948. A confirmed breakout above this level could accelerate gains toward 2961.
However, if gold fails to hold above 2915, bearish pressure could emerge, potentially leading to a decline toward 2900.
Market Watch & Risk Factors
Risk remains elevated amid ongoing trade tensions, making all market scenarios possible.
Key U.S. economic data releases today, including monthly and annual producer price index (PPI) reports and weekly jobless claims, may trigger high market volatility.
Disclaimer: Trading in CFDs involves risks, and all scenarios are possible. This analysis is not investment advice but rather an interpretation of the current technical landscape for gold.
| S1: |