
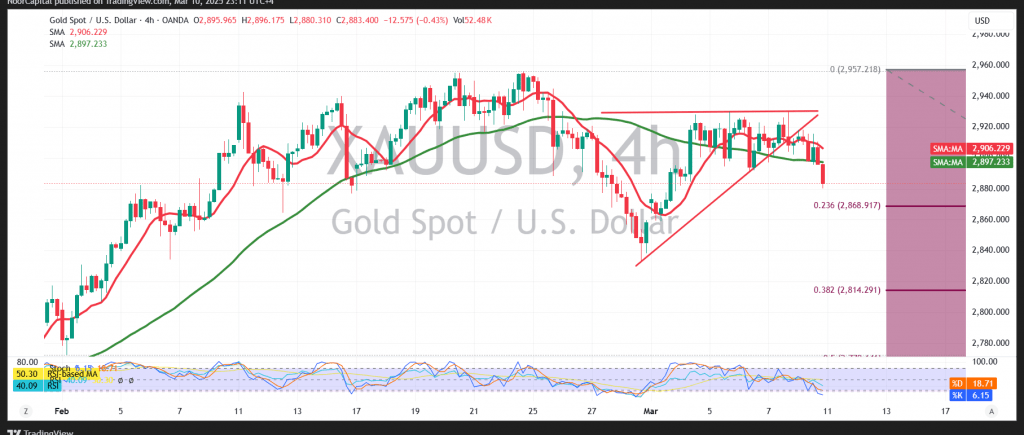
During yesterday’s European session, gold traded sideways, confined by the psychological support at 2900 and a pivotal resistance at 2930.
On the 4‑hour chart, gold began to test the support floor at 2900 during the previous American session, recording a low of $2880 per ounce. Simple moving averages are now exerting downward pressure, in line with negative signals from the Relative Strength Index.
With the break of 2900 confirmed, a bearish trend could develop during today’s session, potentially targeting 2868—the next key level around the 23.60% Fibonacci retracement. However, if trading stabilizes above 2900, there is a possibility of a short-term retest of 2916, although the overall bias remains bearish given that prices are generally staying below 2930.
Risk Considerations:
Today, we are expecting high-impact US economic data on Job Openings and Labor Turnover Survey (JOLTS), which may trigger significant volatility. Additionally, ongoing trade tensions contribute to a high-risk market environment, and all scenarios remain possible.
Disclaimer: Trading in CFDs involves risks, and all scenarios are possible. This analysis is not investment advice but rather an interpretation of the current technical landscape for gold.
| S1: |