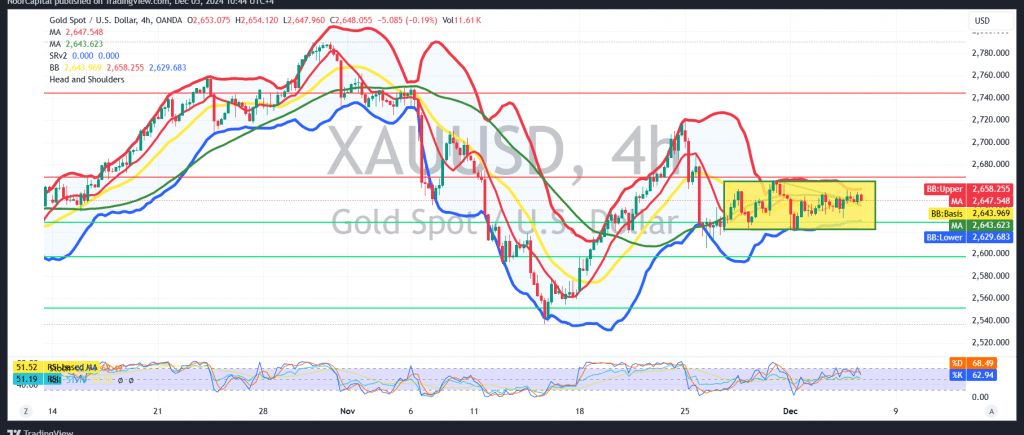
Gold continues to exhibit a sideways trend, trading within a narrow range confined between the support level at 2635 and resistance level at 2657 for several consecutive sessions.
Technical Analysis:
- Positive Signals: The 50-day simple moving average provides upward pressure, hinting at the possibility of a bullish breakout.
- Negative Signals: The Stochastic indicator continues to display bearish momentum, contributing to the prevailing technical conflict.
Scenario Analysis:
- Bullish Case:
A confirmed breakout above the pivotal resistance zone of 2658–2660 could signal a return to the upward path. Initial targets include 2670 and 2684, with a potential extension toward 2700 if momentum persists. - Bearish Case:
A confirmed break below 2637 would favor a corrective decline, targeting 2610 as the first milestone, followed by 2600 as the next significant support.
Key Considerations:
Risk Warning:
The risk level is elevated due to ongoing geopolitical tensions, making all scenarios possible. Adjust trading strategies accordingly.
High-Impact Economic Events:
Today’s release of U.S. “Weekly Unemployment Claims” data could introduce significant volatility to the gold market.
Disclaimer: Trading in CFDs involves risks, and all scenarios are possible. This analysis is not investment advice but rather an interpretation of the current technical landscape for gold.
| S1: |
 Noor Trends News, Technical Analysis, Educational Tools and Recommendations

