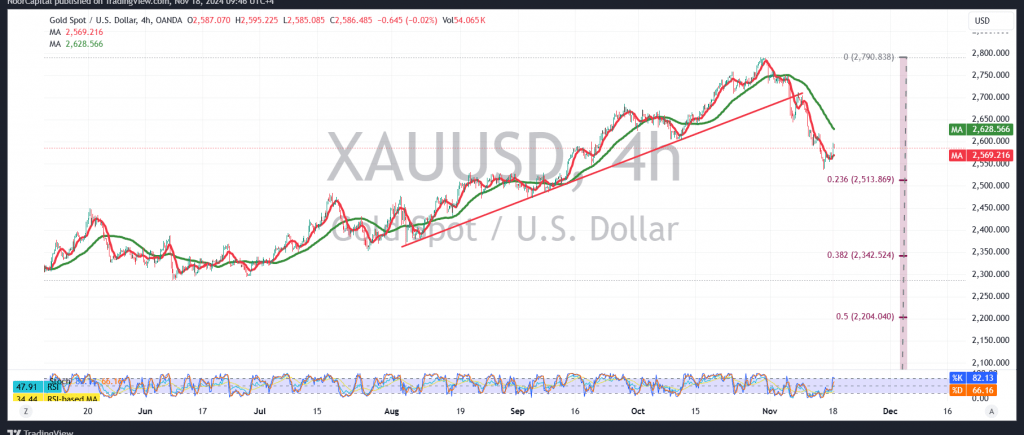
Gold prices fell at the end of last week’s trading, breaking below the support line of the ascending channel, as highlighted in the previous report. This break extended losses, with gold reaching a low of $2554 per ounce.
From a technical analysis perspective, gold has attempted to stage a minor rebound in early trading, hovering around $2597. However, a closer examination of the 4-hour chart reveals that the Stochastic indicator is beginning to lose its upward momentum. This weakening signal is compounded by the continued positioning of gold below the 50-day simple moving average.
As a result, the bearish outlook remains dominant, with expectations for a decline towards $2551. A confirmed break of this level could intensify the downtrend, opening the way for further losses to $2536 and eventually $2518 as key support targets.
However, it’s essential to note that the bearish scenario is conditional on maintaining daily trading stability below $2600, and especially below $2604. A breakout above these levels could trigger a bullish reversal, with potential upward targets at $2615 and $2622.
Warning: The market risks remain elevated, especially amid ongoing geopolitical tensions, making various scenarios plausible.
Disclaimer: Trading in CFDs involves risks, and all scenarios are possible. This analysis is not investment advice but rather an interpretation of the current technical landscape for gold.
| S1: |
 Noor Trends News, Technical Analysis, Educational Tools and Recommendations

