
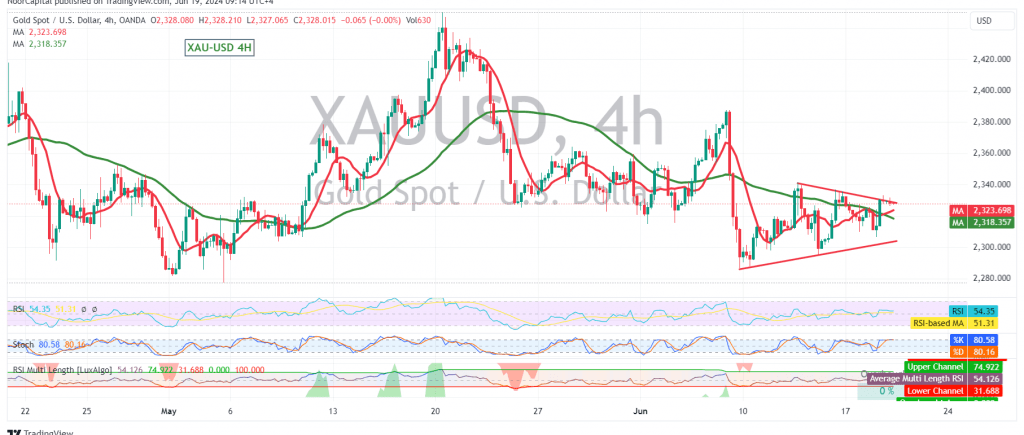
Gold prices remain confined within a narrow sideways range, bounded by the 2313 support level and the 2340 resistance level.
Technical Outlook:
Analysis of the 240-minute chart reveals a bearish flag pattern formation, indicating a potential continuation of the downward trend. The 50-day simple moving average is exerting negative pressure, and the price remains below the crucial 2340 resistance.
Downside Targets:
We anticipate a resumption of the decline, with the initial target at 2295, followed by 2284. A break below these levels would pave the way for a move towards the primary target of 2272.
Upside Risks:
However, traders should remain cautious as a decisive break above the 2340 resistance level could invalidate the bearish scenario. In this case, the price could potentially rise towards 2360 and even 2365.
Key Points:
- Bearish flag formation suggests potential downside continuation.
- 50-day SMA and 2340 resistance level acting as key barriers.
- Downside targets at 2295, 2284, and 2272.
- Break above 2340 could invalidate the bearish scenario.
- High risk due to geopolitical tensions and potential price volatility.
Disclaimer: This analysis is for informational purposes only and should not be considered as financial advice.
Disclaimer: Trading in CFDs involves risks, and all scenarios are possible. This analysis is not investment advice but rather an interpretation of the current technical landscape for gold.
| S1: |