
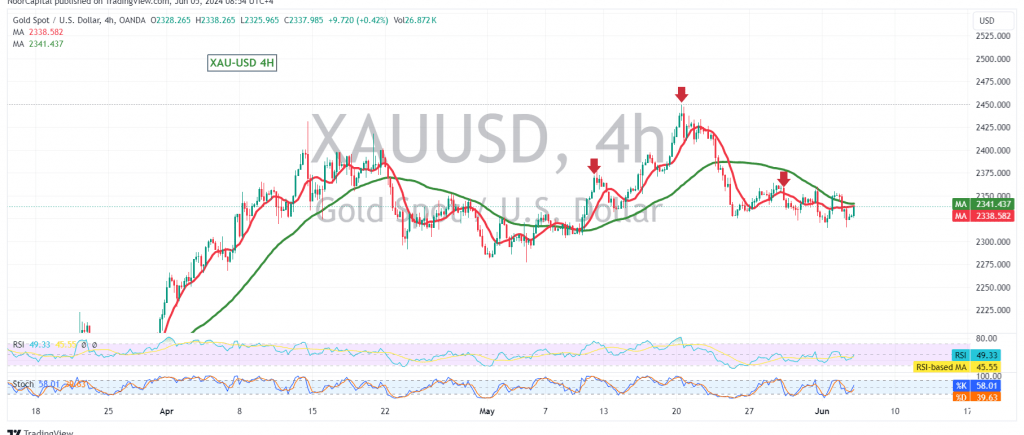
The technical landscape for gold remains largely unchanged, with the precious metal holding above the 2318 support level but facing resistance from the 50-day simple moving average.
Despite yesterday’s upward movement, the 50-day simple moving average continues to exert downward pressure on the price. Additionally, the Stochastic oscillator is showing early signs of negativity, potentially indicating a weakening of the bullish momentum.
For the upward trend to gain traction, a clear and decisive break above the key resistance levels of 2340 and, more importantly, 2360 is necessary. This would confirm a bullish reversal and open the door for potential targets at 2378 and 2391.
Conversely, failure to overcome the 2360 resistance level could lead to a continuation of the bearish correction. A break below the 2318 support level would further solidify the bearish outlook, potentially triggering a move towards the 2272 target level.
Traders should exercise caution today as the U.S. economy is set to release high-impact economic data, including the “Change in Non-Agricultural Private Sector Jobs” report. This data could spark significant volatility in the market, potentially impacting gold prices.
Additionally, ongoing geopolitical tensions continue to contribute to heightened uncertainty and potential price fluctuations in the gold market.
In conclusion, gold prices are currently at a crossroads, with both bullish and bearish scenarios possible. A decisive break above 2360 would signal a bullish reversal, while a failure to overcome this level could lead to further downside movement. Traders should closely monitor the price action around these key levels and be prepared for potential volatility due to the upcoming economic data release and ongoing geopolitical risks.
Disclaimer: Trading in CFDs involves risks, and all scenarios are possible. This analysis is not investment advice but rather an interpretation of the current technical landscape for gold.
| S1: |